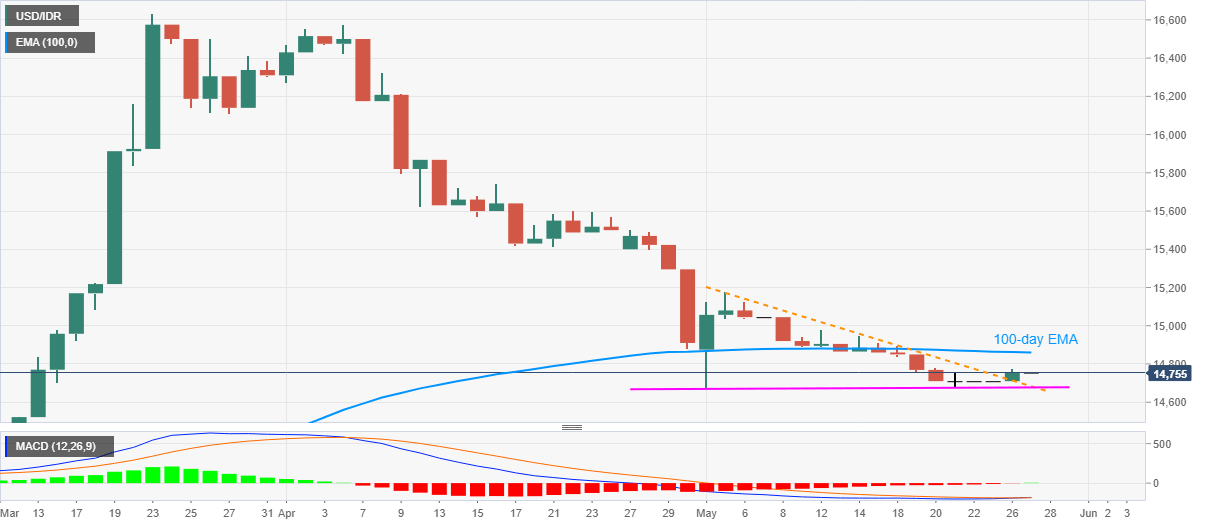
USD/IDR Price News: Indonesian rupiah struggles to justify break of monthly support line
by Anil Panchal- USD/IDR buyers pause after refreshing weekly top of 14,778 the previous day.
- MACD teases bulls following the break of near-term key resistance line, now support.
- 100-day EMA gains attention during further upside, bears will refrain entries unless witness fresh monthly low.
Having benefited from the break of monthly resistance line the previous day, USD/IDR seesaws around 14,755 during Wednesday’s Asian session.
Other than the sustained trading beyond the previous resistance line, MACD histogram also keeps the bulls hopeful.
As a result, a 100-day EMA level of 14,860 is in the spotlight during further upside. Though, 15,000 round-figure and the May 05 top near 15,180 could question the buyers afterward.
Meanwhile, 14,680/75 becomes the key support area for pair traders to watch as it comprises the resistance turned support as well as an ascending trend line from May 04.
In a case where the bears manage to conquer 14,675 support, the early March high near 14,420 could gain the market’s attention.
USD/IDR daily chart

Trend: Further recovery expected
Additional important levels
| Overview | |
|---|---|
| Today last price | 14710 |
| Today Daily Change | -45.0000 |
| Today Daily Change % | -0.30% |
| Today daily open | 14755 |
| Trends | |
|---|---|
| Daily SMA20 | 14919.95 |
| Daily SMA50 | 15536.1798 |
| Daily SMA100 | 14714.9534 |
| Daily SMA200 | 14395.9052 |
| Levels | |
|---|---|
| Previous Daily High | 14778 |
| Previous Daily Low | 14710 |
| Previous Weekly High | 14899 |
| Previous Weekly Low | 14680 |
| Previous Monthly High | 16575 |
| Previous Monthly Low | 14880 |
| Daily Fibonacci 38.2% | 14752.024 |
| Daily Fibonacci 61.8% | 14735.976 |
| Daily Pivot Point S1 | 14717.3333 |
| Daily Pivot Point S2 | 14679.6667 |
| Daily Pivot Point S3 | 14649.3333 |
| Daily Pivot Point R1 | 14785.3333 |
| Daily Pivot Point R2 | 14815.6667 |
| Daily Pivot Point R3 | 14853.3333 |