Materials And Energy Dashboard - Update
by Fred PiardSummary
- Valuation metrics in basic materials and energy.
- Evolution since last month.
- A list of stocks looking cheap in their industries.
This article series provides a monthly dashboard of industries classified by sectors. It compares valuation and quality factors relative to their historical averages in each industry.
Executive summary
After being hit by two black swans, COVID-19 and an oil price war, WTI crude oil has switched to rally mode a month ago. The energy sector (XLE) is now 68% above the low of March, but still 39% below the 52-week high and about 61% below the high of 2014. Fundamental data embed a lot of uncertainty in most companies, even more in energy. Valuation ratios in the energy sector are apparently very attractive, but profitability is far below the historical baseline. Metals/mining are fairly priced and profitability is also far below the baseline. Combining valuation and profitability, chemicals and construction materials seem to be the most attractive industries in this review. However, the Chemical Activity Barometer is bearish.
Since last month:
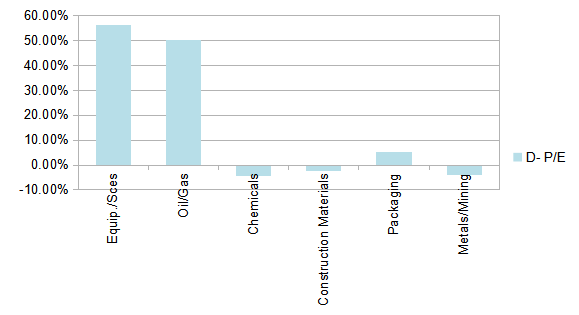
- P/E has improved in energy equipment/services and deteriorated elsewhere.
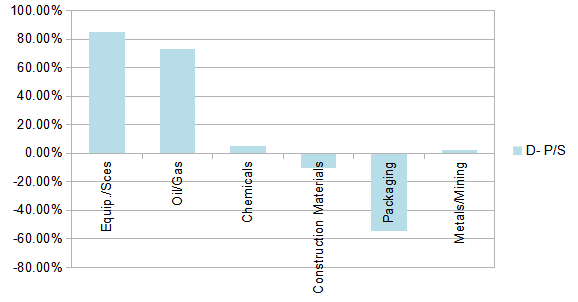
- P/S has improved in construction materials and deteriorated elsewhere.
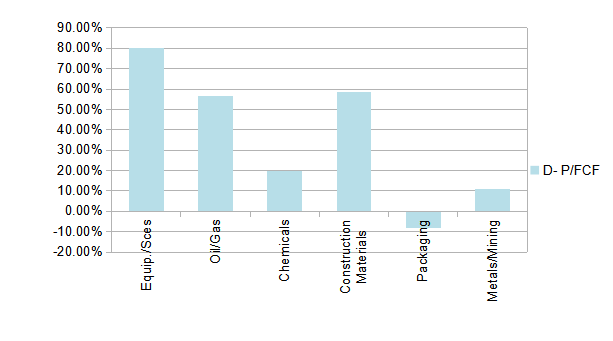
- P/FCF has improved in energy equipment/services and deteriorated elsewhere.
- The SPDR Select Sector ETF in energy (XLE) and materials (XLB) have outperformed the SPDR S&P 500 ETF by about 9% and 3%.
- The five S&P 500 stocks in energy and materials with the best momentum in 1 month are Halliburton Co. (HAL), Marathon Petroleum Corp. (MPC), Noble Energy Inc. (NBL), Phillips 66 (PSX), Valero Energy Corp. (VLO).
Some cheap stocks in their industries
The stocks listed below are in the S&P 1500 index, cheaper than their respective industry factor for price/earnings (excluding extraordinary items), price/sales and price/free cash flow. The 10 companies with the highest return on equity are kept in the final selection. The list was published for subscribers at the beginning of the month based on data available at this time. This is not investment advice. Do your own research before buying.
Detail of valuation and quality indicators in energy and materials on 5/26/2020
I take 4 aggregate industry factors: price/earnings (P/E), price to sales (P/S), price to free cash flow (P/FCF), return on equity (ROE). My choice has been justified here and here. Their calculation aims at limiting the influence of outliers and large caps. They are reference values for stock picking, not for capital-weighted indices.
For each factor, I calculate the difference with its own historical average: to the average for valuation ratios, from the average for ROE, so that the higher is always the better. The difference is measured in percentage for valuation ratios, not for ROE (already in percentage).
The next table reports the 4 industry factors. There are 3 columns for each factor: the current value, the average ("Avg") between January 1999 and October 2015 taken as an arbitrary reference of fair valuation, and the difference explained above ("D-xxx").
| P/E | Avg | D- P/E | P/S | Avg | D- P/S | P/FCF | Avg | D- P/FCF | ROE | Avg | D-ROE | |
| Equip./Sces | 10.60 | 24.2 | 56.18% | 0.27 | 1.73 | 84.62% | 6.95 | 35.34 | 80.34% | -12.98 | 7.34 | -21.49 |
| Oil/Gas | 9.23 | 18.53 | 50.20% | 0.91 | 3.35 | 72.91% | 12.56 | 29.03 | 56.75% | -1.45 | 4.47 | -9.67 |
| Chemicals | 19.28 | 18.48 | -4.34% | 1.15 | 1.21 | 5.26% | 20.33 | 25.37 | 19.87% | 3.98 | 6.74 | 3.01 |
| Construction Materials | 21.95 | 21.44 | -2.37% | 1.28 | 1.16 | -10.15% | 16.82 | 40.5 | 58.48% | 5.75 | 5.77 | 6.05 |
| Packaging | 17.01 | 17.96 | 5.29% | 0.94 | 0.61 | -54.67% | 21.77 | 20.09 | -8.36% | 14.18 | 8.34 | 15.93 |
| Metals/Mining | 20.64 | 19.83 | -4.06% | 2.58 | 2.65 | 2.58% | 22.76 | 25.53 | 10.87% | -19.59 | -8.6 | -20.25 |
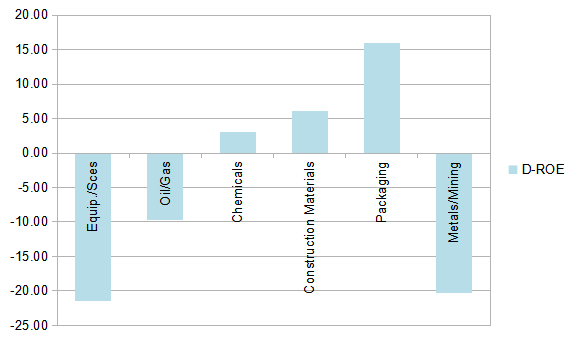
The following charts give an idea of the current status of 3 valuation factors (P/E, P/S, P/FCF) and a quality factor (ROE) relative to their historical average in each industry. For all factors, the difference to average is calculated in the direction where positive is good. For valuation ratios, lower is better. For ROE, higher is better. On the charts below, higher is always better.
Price/Earnings relative to historical average:
Price/sales relative to historical average:
Price/free cash flow relative to historical average:
ROE relative to historical average:
Momentum
The next chart compares the price action of XLB and XLE with the benchmark in 1 month.
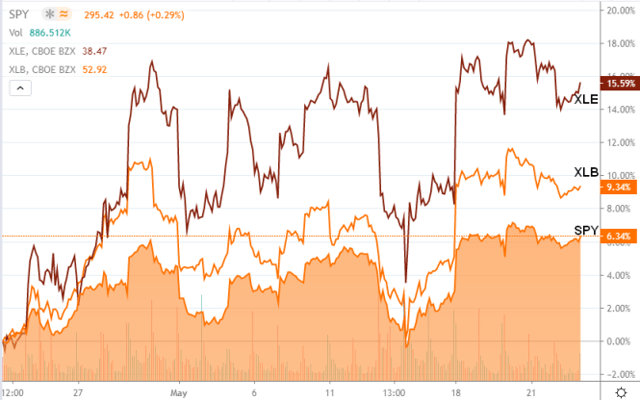
Chart by TradingView
Disclosure: I/we have no positions in any stocks mentioned, and no plans to initiate any positions within the next 72 hours. I wrote this article myself, and it expresses my own opinions. I am not receiving compensation for it (other than from Seeking Alpha). I have no business relationship with any company whose stock is mentioned in this article.