EUR/USD Price Analysis: Upside momentum fades below 1.1000
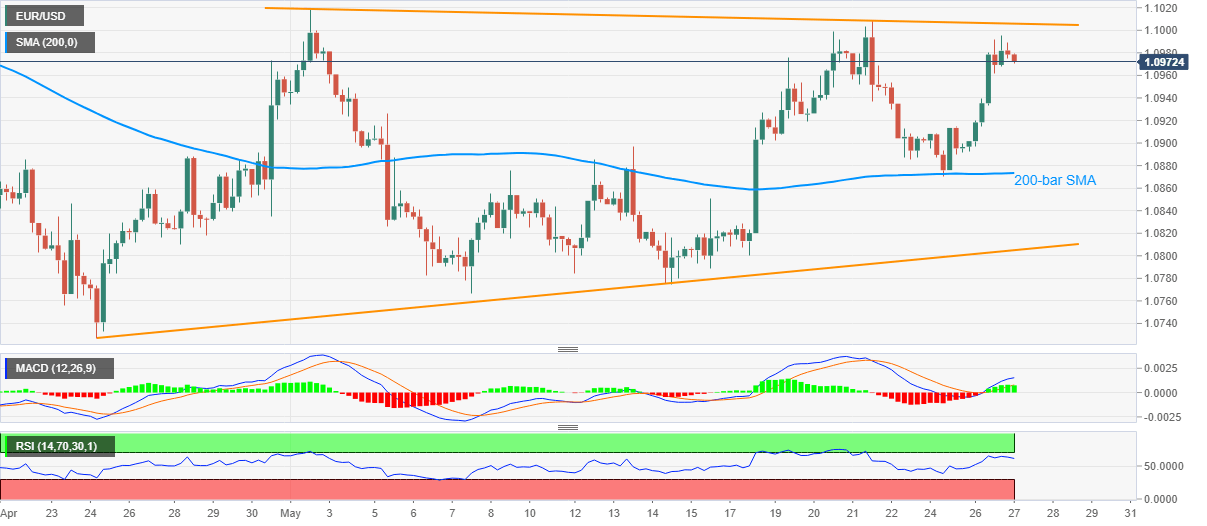
by Anil Panchal- EUR/USD steps back from one-week top, still above 200-bar SMA.
- Monthly falling trend line becomes the key immediate upside barrier.
- Ascending trend line from April 24 adds to the support.
EUR/USD retreats from 1.0996 to currently around 1.0972, down on 0.09% a day, during Wednesday’s Asian session. The pair’s recent pullback takes clues from nearly overbought RSI conditions, coupled with the proximity to important resistance.
That said, the pair can revisit 1.0900 support while 200-bar SMA near 1.0870 could restrict further downside.
If sellers refrain to respect 1.0870 rest-point, a month-old rising support line, at 1.0800 now, could grab the market attention.
On the upside, a sustained break above the falling trend line from May 01, currently near 1.0005, could set the tone for a fresh run-up that challenges a monthly top near 1.1020.
EUR/USD four-hour chart

Trend: Pullback expected
Additional important levels
| Overview | |
|---|---|
| Today last price | 1.0974 |
| Today Daily Change | -8 pips |
| Today Daily Change % | -0.07% |
| Today daily open | 1.0982 |
| Trends | |
|---|---|
| Daily SMA20 | 1.0884 |
| Daily SMA50 | 1.0879 |
| Daily SMA100 | 1.0961 |
| Daily SMA200 | 1.1013 |
| Levels | |
|---|---|
| Previous Daily High | 1.0996 |
| Previous Daily Low | 1.0892 |
| Previous Weekly High | 1.1009 |
| Previous Weekly Low | 1.08 |
| Previous Monthly High | 1.1039 |
| Previous Monthly Low | 1.0727 |
| Daily Fibonacci 38.2% | 1.0956 |
| Daily Fibonacci 61.8% | 1.0932 |
| Daily Pivot Point S1 | 1.0918 |
| Daily Pivot Point S2 | 1.0854 |
| Daily Pivot Point S3 | 1.0815 |
| Daily Pivot Point R1 | 1.1021 |
| Daily Pivot Point R2 | 1.106 |
| Daily Pivot Point R3 | 1.1124 |