Newmont Corporation: Digging Into The Q1 Results
by Taylor DartSummary
- Newmont Corporation released its Q1 results earlier this month, reporting quarterly gold production of 1.5 million ounces at all-in sustaining costs just above $1,000/oz.
- Fortunately, the majority of the company's operations remain unaffected by COVID-19 related challenges, with only Penasquito and Musselwhite remaining offline for the time being.
- While Newmont continues to see massive growth in annual EPS due to a higher gold price and increased production, I continue to see the stock as extended short-term above $65.00.
- Therefore, I see more attractive opportunities elsewhere in the sector, and I see no reason to chase the stock above $65.00.
We're now more than two-thirds of the way through the Q1 earnings season for the Gold Miners Index (NYSEARCA:GDX), and we've seen massive earnings growth across the board for most senior gold producers, with Newmont Corporation (NYSE:NEM) being a stand-out name in the group. The company reported solid Q1 results with quarterly gold production up 15% year over year to 1.5 million ounces despite COVID-19 related challenges that weighed on operations in the last week of March. This robust production growth, coupled with a much higher average realized gold (NYSEARCA:GLD), contributed to what should be a year of massive growth in annual earnings per share [EPS], with estimates of $2.18 in annual EPS in FY-2020. While this is great news long term, and the industry-leading dividend yield of 1.5% continues to embolden the investment thesis, I continue to see the stock as short-term extended, with the risk/reward balanced at best above $65.00. Therefore, I believe there are more attractive opportunities elsewhere in the sector, and I see no reason to chase the stock above $65.00.

(Source: Company Website)
Newmont Corporation released its Q1 results earlier this month, reporting quarterly gold production of 1.5 million ounces at all-in sustaining costs of $1,030/oz. Unfortunately, while Q1 was relatively in line with initial guidance of 6.4 million ounces of gold production in FY-2020, Q2 will be a more challenging quarter with Penasquito and Musselwhite still on care and maintenance, which contribute to roughly 11% of the company's total FY-2020 planned gold production. This led to Newmont pulling its FY-2020 guidance, and since revising guidance lower to 6 million ounces of gold production this year, 6.5% below prior guidance. Meanwhile, we also saw a significant jump in all-in sustaining costs in the updated guidance, with consolidated gold-equivalent ounce cost guidance jumping over 20% to $1,075/oz, from $880/oz previously. These are still more than respectable costs, given the higher gold price we're working with, but this should be a slight anchor on the higher margins the company should have been enjoying with a $1,650/oz plus gold price. Let's take a look at the company's growth metrics below:
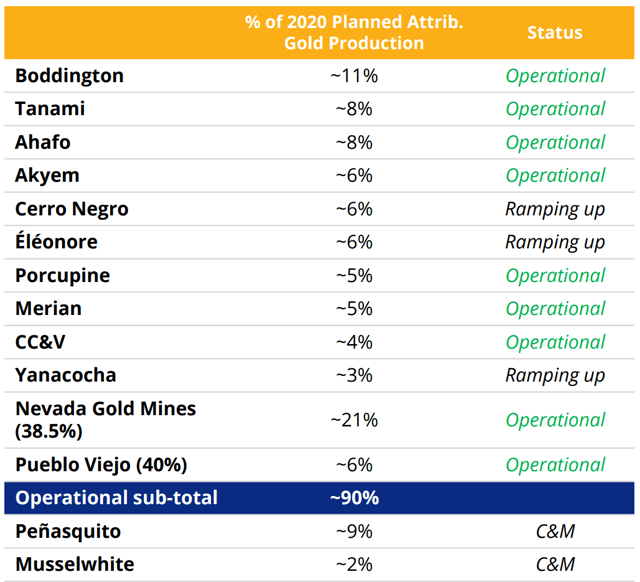
(Source: Company Presentation)

(Source: Company News Release)
As we can see from the chart below of annual earnings per share, Newmont is having a breakout year for profits in FY-2020, a bullish development. Currently, FY-2020 estimates are sitting at $2.18, translating to 65% growth year over year, more than double the industry average earnings growth rate expected in FY-2020. Meanwhile, FY-2021 earnings per share estimates are currently sitting at $3.03, translating to yet another year of strong double-digit annual EPS growth. This is quite bullish for Newmont long term, as few companies in the market are currently capable of producing earnings growth of this magnitude. The major contributor to this strong earnings growth is 15% higher production year over year after integration of the Goldcorp (NYSE:GG) assets, as well as a 20% higher gold price year over year, with an average realized selling price of $1,591/oz in Q1 2020. Assuming these estimates of $2.18 are met, the stock commands a minimum share price of $54.50, or a 25x multiple on forward earnings.
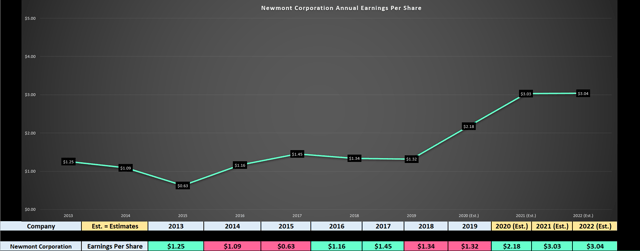
(Source: YCharts.com, Author's Chart)
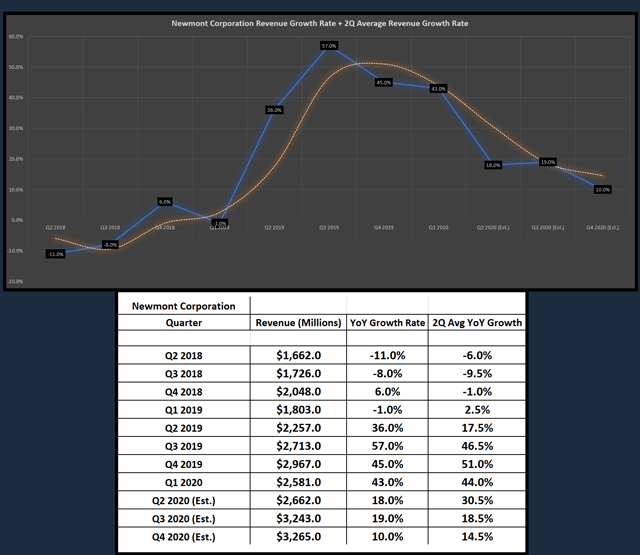
If we move over to quarterly revenue growth rates below, we can see revenue growth rates confirming this earnings growth, a positive sign. One of the worst signs for a company with growing earnings is lackluster revenue growth, as it shows that the annual EPS growth is being brought on by one-time items, tax benefits, or cost-cutting. None of these factors are sustainable long term. This is not the case for Newmont, and this confirms that this growth is sustainable and suggests that $3.00 in annual EPS for FY-2021 is not unreasonable. As we can see, quarterly revenue came in at $2.58 billion in Q1, up 43% year over year, and is expected to hit a multi-year high at $3.26 billion in Q3 2020, assuming we don't see a nasty second wave of COVID-19 that spurs further shutdowns.
(Source: YCharts.com, YCharts.com)
While the quarterly revenue growth rate is likely to trend significantly lower over the next few quarters, I do not see this as an issue. This is because the company is up against challenging year-over-year comps with 43%, 45%, and 47% quarterly revenue growth rates in the past three quarters. Outside of a parabolic move in the gold price, these growth rates are near impossible for a cyclical company to reproduce year over year. While not directly related to sales growth, it's worth noting that, even though quarterly revenue will see a minor headwind in Q2 based on the absence of Musselwhite and Penasquito for most of Q2, the company has seen a tailwind from crude oil prices and the Australian Dollar. As noted in the Q1 call, Newmont had budgeted for a 0.75 Australian Dollar/US Dollar exchange rate, and every nickel below this level will result in an extra $45 million free cash flow. Meanwhile, every $10 drop in crude oil translates to $25 million in free cash flow. Based on a current Australian Dollar/US Dollar exchange rate of $0.65, and a crude oil price near $30.00, we could see an extra $120 million in free cash flow tailwind this year due to lower costs in these areas.
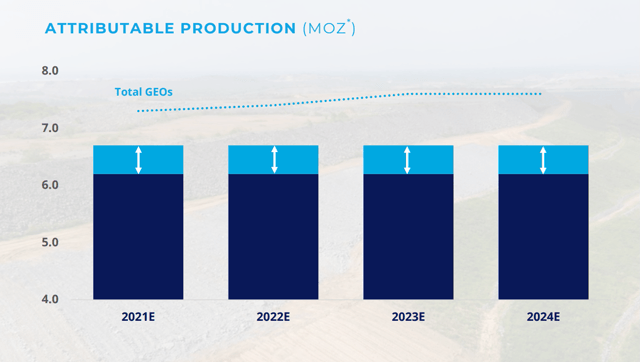
(Source: Company Presentation)
If we look at attributable gold production going forward, we're not likely to see the needle move much in terms of production growth, and therefore, we've seen most of the gains in this department. The 4-year outlook calls for relatively flat production growth year over year, with a minor increase in gold equivalent ounce production in FY-2023 and FY-2024. However, the company is expected to see significant synergies with the Nevada Gold Mines Joint Venture with Barrick Gold (GOLD), and this should help to drive all-in sustaining costs below $900/oz long term. Therefore, when it comes to earnings growth going forward, Newmont is going to have to rely on the gold price and cost-cutting, hence why the FY-2022 EPS estimates are showing muted growth year over year, based on current estimates of $3.04, vs. estimates of $3.03 in FY-2021.

(Reuters.com, Rick Wilking)
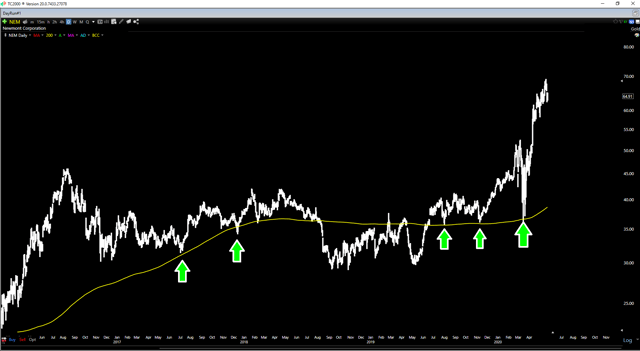
In summary, from a growth standpoint, there's a lot to like about Newmont here, and those looking at the fundamentals alone can certainly make a case for a floor of $50.00 - $54.50 for the stock based on valuation. The issue, however, comes down to the technical picture, and the fact that the stock is nearly 50% above its 200-day moving average at $65.00 per share. While stocks may look like they're going to grow to the sky, they rarely do, and it rarely pays to add exposure when everyone is busy piling into a trade. Given that Newmont is the most overbought it's been in several years, I would argue that this is beginning to become a crowded trade short-term above $65.00. This does not mean I would short the stock and bet on significantly lower prices, but it does mean that adding new exposure above $65.00 is probably not the greatest idea. Let's take a look at the technical picture below:
(Source: TC2000.com)
As we can see from the daily chart, the best opportunities to buy Newmont have been near the green arrows in the chart, which have coincided with the stock testing its long-term moving average (yellow line). Conversely, the worst times to jump in Newmont have been when the stock is extended above its long-term moving averages, such as January 1996, October 2003, October 2011, and June 2016. While Newmont briefly went higher during most of these periods, it typically traded 25% to 30% lower over the next six months, suggesting that there are much better opportunities on the horizon for those that were patient. We are currently at a similar juncture, but we're working with one of the highest gold prices to date, suggesting this time could be a little different. However, "this time is different" might mean a more shallow correction before higher prices vs. the typical 20-30% correction. Still, it doesn't mean completely ignore the extended chart and plow new money into the stock above $65.00 per share. Chasing above $65.00 could work, and anything is possible, but history suggests it rarely pays off short-term typically better opportunities present themselves over the next three to six months.

(Source: Burgundy Asset Management)
In summary, while Newmont has exceptional fundamentals and is clearly a top-10 name in the sector. I believe investors would be wise to exercise discipline and not chase the stock above $65.00. In fact, if I was trading Newmont and had yet to book any profits, I believe any spikes above $64.00 would be an opportunity to sell a one-fourth position to lock in some profits. A reliable production profile, margin expansion, and a path towards lower costs are clear tailwinds for Newmont long term, but chasing cyclical companies that are up 110% in less than 50 trading days rarely pays off. Trees don't grow to the sky, and stocks are the same, stair-stepping higher in a methodical fashion vs. rising at a parabolic rate forever. While a correction is not guaranteed, it would be healthy and completely normal based on past precedents, allowing the stock to digest its gains before its next leg higher.
Disclosure: I am/we are long GLD. I wrote this article myself, and it expresses my own opinions. I am not receiving compensation for it (other than from Seeking Alpha). I have no business relationship with any company whose stock is mentioned in this article.
Additional disclosure: Disclaimer: Taylor Dart is not a Registered Investment Advisor or Financial Planner. This writing is for informational purposes only. It does not constitute an offer to sell, a solicitation to buy, or a recommendation regarding any securities transaction. The information contained in this writing should not be construed as financial or investment advice on any subject matter. Taylor Dart expressly disclaims all liability in respect to actions taken based on any or all of the information on this writing.