Capturing The Trend In Cryptocurrencies
by Opportunity TraderSummary
- Bitcoin's price volatility reaches 6-year high.
- The upward momentum of cryptocurrencies can create enormous returns on investment, but the downside risk is substantial.
- Our mechanical strategy captures the upside potential while lowering the downside risk.
2020 has been a volatile year so far for Bitcoin (BTC-USD) investors. The value of the cryptocurrency started the year initially strong, as the value rose from $7,200 to $10,450 by mid-February, only to decline in the coming weeks to a low value of $4,100 by mid-March.
The decline in March 2020 caused the volatility of Bitcoin to reach a new high level of 167%. While this volatility peak was a new record for Bitcoin, the cryptocurrency has gone through volatile price swings in the previous years as well.

Source: bitcoin.com
I have always been surprised by the strong bullish/bearish conviction most people have on Bitcoin. The supporters strongly believe Bitcoin will become a global currency while the critics call it fool's gold. Personally, I don't hold a bullish vision nor a bearish vision on the cryptocurrency. A lot of discussions have been going on the recent halving of Bitcoin, the profitability of mining in 2020, the impact of COVID-19 on Bitcoin, ... Regardless of these discussions, our major interest is in the price performance of Bitcoin and other cryptocurrencies.
The upward momentum of these currencies has been unprecedented and creates trading opportunities we cannot ignore. In this article we will present a trading strategy that intends to capture the upside momentum of the cryptocurrencies, while reducing the downside risk.
The problem of buy & hold
In our previous article, we pointed out a simple buy & hold strategy is not suited for Bitcoin. This strategy is good when Bitcoin rises strongly in value, but is terrible once Bitcoin starts one of its famous strong price corrections.
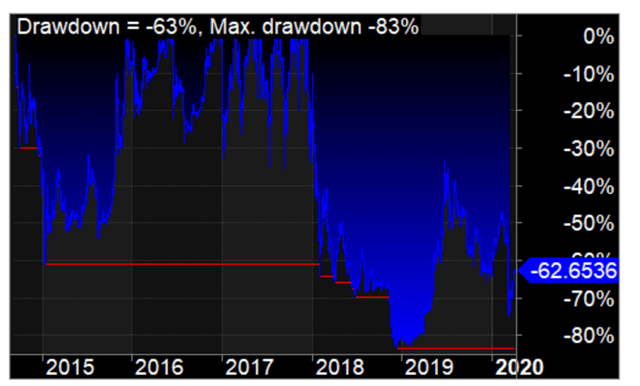
In the chart below the underwater equity of a buy & hold strategy is demonstrated throughout 2015-2020. As you can see from this chart, Bitcoin has multiple times corrected strongly in value, which would have depleted the profitability of your investment.
Source: chart created by the author with Amibroker
If you would have bought Bitcoin at the beginning of 2020 you would have gone through the following downside equity swings:
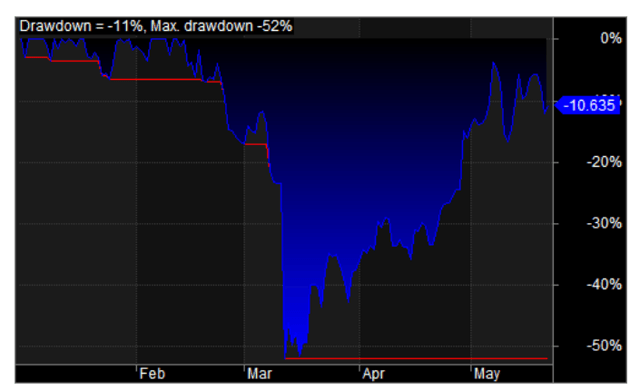
That's right, again a casual 50% drawdown in value. To get back to even from a 50% price decline, a 100% increase in value is required just to get back to even. Other cryptocurrencies (XRP-USD, ETH-USD) are exposed to these strong price corrections as well.
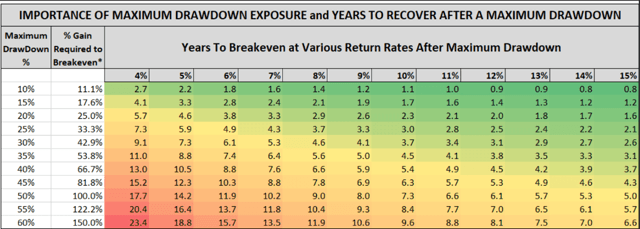
The main issue here is the required % gain an asset has to reach just to get back to even. A 50% decline requires a 100% increase just to get back to even. In the long run, this strongly diminishes your total return on investment.
Source: Article from SeekingAlpha
Trend Following Strategy
In order to benefit from the upside potential of the underlying cryptocurrency, while keeping the downside risk at an acceptable level, we will implement a mechanical trend following strategy. In this strategy all buy and sell signals are generated mechanically by a simple technical indicator.
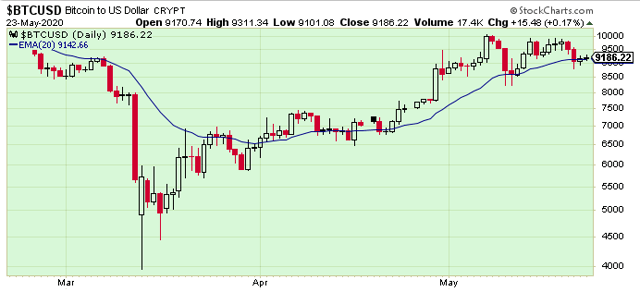
More specifically, for Bitcoin, we will calculate a 20-day exponential moving average (EMA-20) of the price and purchase the cryptocurrency each time its price crosses above this moving average. When the price crosses below the moving average, we will sell Bitcoin at the next open. Why do we use this indicator with this parameter:
- exponential moving averages give a higher weighting to more recent price data, which makes them quicker to react to price changes.
- 20-days to ensure we capture any upward trend from the beginning. We could also use 10 or 30 days, but preferably not more than 50 days.
In the chart below the blue line represents the moving average:
Source: stockcharts.com
The main goal of this strategy is twofold:
1) Capture the upside momentum of the underlying cryptocurrency
2) Lower the downside risk which would come with a simple buy & hold strategy
Historical results of the Strategy
In the table below we can see the results of our backtests for the buy & hold strategy and the EMA-20 strategy over period January 2015 - December 2019.

Source: Backtest results created by the author
When we compare the results of both strategies we can see the following:
- The EMA 20 strategy manages to capture the upside potential of all 3 cryptocurrencies, resulting in a significantly higher ROI.
- The downside is halved for Bitcoin and Ethereum and cut by 25% for Ripple.
So far, so good. The EMA-20 strategy captures the upside momentum and gets us out in time before a large price correction occurs. Now let's have a look at how the strategy would have done in volatile 2020 when the Coronavirus shook the global markets.
Results of the Strategy in 2020
In the table below the results are shown for both strategies, starting on 1 January 2020 and ending on 23 May 2020.

Observations from the table:
- The EMA strategy outperforms the ROI of the buy & hold strategy for the 3 cryptocurrencies
- The EMA strategy again strongly lowers the downside risk
For Bitcoin, we would have made the following trades in 2020:
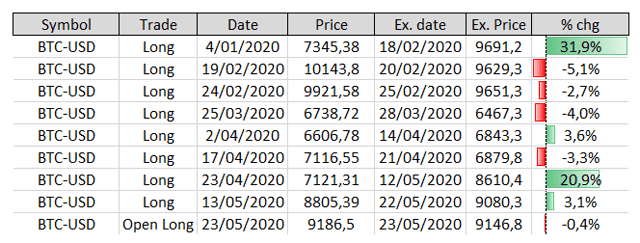
As you can see from this list, we would have made 9 trades of which 4 would have been winners. These winners managed to capture a large part of the upward momentum.
Risks of the EMA-20 Strategy
While the results of our EMA-20 strategy look promising, we do want to emphasize this strategy is not necessarily suited for everyone. All the trading signals are generated by a mechanical rule (the 20-day exponential moving average) and it requires the trader to execute them without hesitating. This requires a mindset in which you have sufficient trust in the strategy to go along with it.
From our backtest results we see the EMA-20 strategy generates a high number of trades, of which a large number tend to be small losers. For Bitcoin, for example, it is possible to have 6 losers in a row before you hit a winning trade. These winning trades historically resulted in sufficient profitability to overcome the losing trades, but you need to execute each trade as the strategy generates them. We can imagine traders would start distrusting the strategy as the losing trades would come in.
Another potential issue might be to hold on to your winning trades long enough and only close them once a sell signal comes in. You need to have the courage and patience to ride out the trend and not take your profits too quickly.
In the simulated backtests we did not take any transaction costs into consideration, nor did we include potential bid/ask spread effects.
Conclusion
In this article, we have presented a simple technical trading system to capture the upward momentum in cryptocurrencies, while reducing the downside risk.
Our strategy outperforms the buy & hold strategy historically (2015-2019) and in volatile 2020 as well. The outperformance was observed for the 3 major cryptocurrencies.
We do recommend traders to be aware of the risks of the strategy and the mindset it requires. Cryptocurrencies have been highly volatile in the past and will likely remain volatile in the near future.
Disclosure: I/we have no positions in any stocks mentioned, and no plans to initiate any positions within the next 72 hours. I wrote this article myself, and it expresses my own opinions. I am not receiving compensation for it (other than from Seeking Alpha). I have no business relationship with any company whose stock is mentioned in this article.