Applied Materials - A Buy, But Expect A Rollercoaster Ride
by Value NinjaSummary
- Applied Materials is a leading maker of semiconductor capital equipment, and represents one way to play the long-term secular growth in compute power and digital intelligence.
- Near-term cyclicality poses a risk in the short-term, with the shares currently pricing in a recovery towards the end of the year. Sentiment swings will create more volatility.
- The company benefits from a solid balance sheet with flexibility to withstand a downturn. Capital will continue to come back to shareholders as dividends and buybacks.
- The recent lows seen in March created a highly asymmetric opportunity for investors, but the rally has since eroded this risk/ reward. The shares now look more fairly valued.
- The shares are a BUY at current levels, but risks from near-term volatility are high. I see annual returns of 10% to 25% for long-term investors.
Following a rudimentary screening process that highlighted some potential stock ideas (outlined in my earlier article "Turning Over Rocks - Hunting for New Ideas"), I turned my attention to Applied Materials (AMAT), a manufacturer of semiconductor capital equipment.
The global semiconductor equipment space is very cyclical and AMAT is thus a relatively volatile and high-beta stock. This clearly suggests that timing can create significant value for shareholders by buying after a downturn in the shares. However, the underlying returns, fundamentals and balance sheet of this business, coupled with some strong long-term secular tailwinds, also create a decent set-up for maintaining a decent long-term position.
Having already touched a trough P/ FCF multiple (see the chart below) in the recent market collapse, AMAT shares have since rallied hard. Typically, once a trough has been reached, the stock emerges into a new up-cycle.
With current valuations around long-term averages, this suggests there is further upside as the stock marches towards peak valuations.
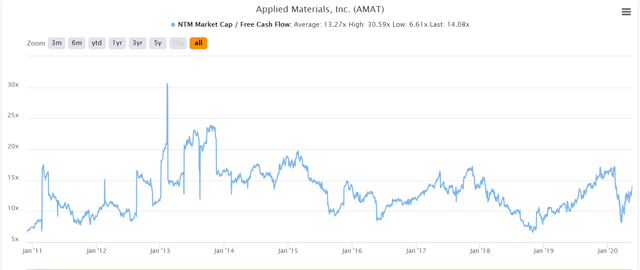
source: TIKR.com
However, if Covid-19 fails to dissipate and the world plunges into a sustained recession, if not depression, then there is still material downside for AMAT. Fortunately the company benefits from a rock-solid and conservative balance sheet, so survivability is not a serious concern in my opinion.
At these levels, AMAT looks about fairly valued. However, the long-term secular demand drivers in the form of artificial intelligence (NYSE:AI), the Internet of Things (IOT), connectivity and big data, make AMAT an interesting longer-term investment.
I would argue investors should initiate an investment at current levels, keeping flexibility to build up the position on any material weakness. They should be rewarded with attractive total returns over the next 5 years.
Background
AMAT describes their business as "materials engineering", but in simple terms they sell large, highly technological, capital equipment for the manufacturing of semiconductor chips and advanced displays. Their equipment exists to provide their customers with more efficient, lower cost and higher-yielding technologies for the production of silicon-based semiconductor chips, also known as integrated circuits. The company also provides service solutions for optimising semiconductor fabrication facilities, as well as capital equipment for the manufacturing of advanced liquid crystal displays (LCDs) and organic light-emitting diode displays (OLEDs).
The core products are high-tech and often very big equipment and AMAT, along with their competitors, charge a lot for it. Equipment can cost anywhere from $700k to $4 million, or even upwards of $100 million, very much depending on purpose and spec.
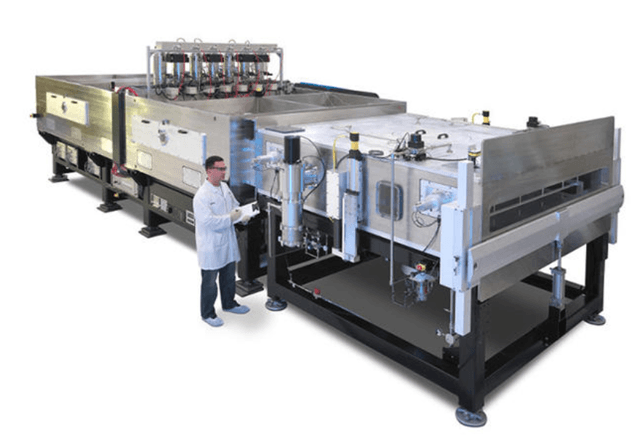
AMAT's product range spans multiple elements of the semiconductor manufacturing process, as depicted in the following table from their most recent annual report:
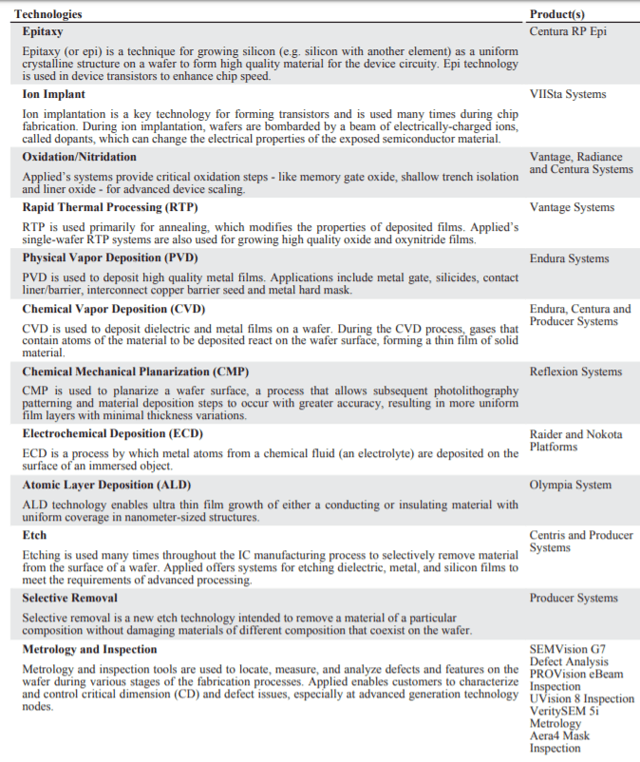
source: Applied Materials 2019 Annual Report and 10K
AMAT is the market leader in the space, based on product revenues across the entire "wafer fab equipment" (WFE) market. The following charts are derived from the USD revenues for CY2019 and CY2016 for the main players in the space, ASML Holding (ASML), Lam Research (LRCX), Tokyo Electron (OTCPK:TOELF), and KLA Tencor (KLAC):
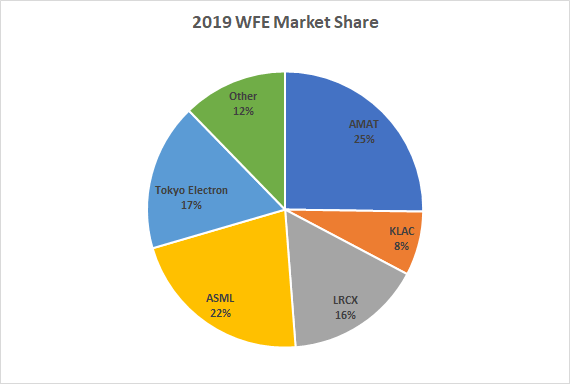
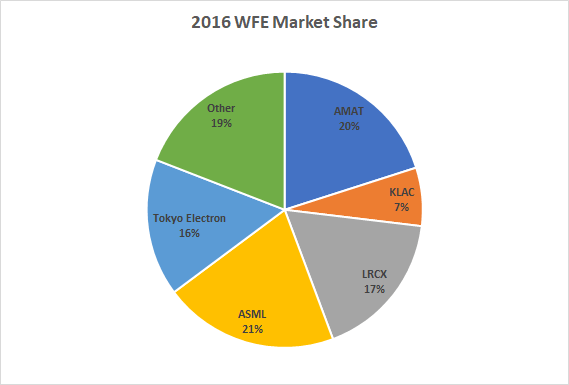
source: company earnings reports, semiconductor equipment segments only, excludes display
It is interesting to note that according to these numbers, AMAT was actually neck and neck with ASML back in 2016, but has since extended the lead by gaining a further 500bp of share versus ASML's 200bp. Furthermore, ALL of the key players gained share from 2016, though AMAT has taken the lion's share of the incremental pie. The industry is becoming increasingly consolidated, with these top 5 players moving from 81% share to close to 92% share in 2019. This is good news for pricing and returns, so long as customer concentration has not risen in tandem - but actually customer concentration at AMAT appears to have declined over the last 2 years, as shown in the following table depicting the revenue concentration of 10%+ customers:

source: from 2019 10-K
I won't pretend to be a technology specialist on semiconductor capital equipment, but I feel confident that the industry is unlikely to change all that much in terms of market share shifts. Consolidation will continue, but likely via organic means. In 2016, LRCX called off its deal to buy KLAC, and the year before that AMAT pulled its deal to buy Tokyo Electron - both because of trouble with US antitrust regulators. Consolidation among the top 5 players looks challenging.
AMAT's semiconductor equipment business represents 62% of revenues as of FY2019. The remainder is split between Applied Global Services at around 26%, and Display & Adjacent Markets (like Solar) at 11%. Clearly the driving force of the company is the semiconductor business, and that will persist for the foreseeable future in my opinion.
With all this in mind, I believe demand will be the real driving force of the industry and the stocks. And demand has both cyclical and secular drivers over the short- and longer-term.
Cyclicality
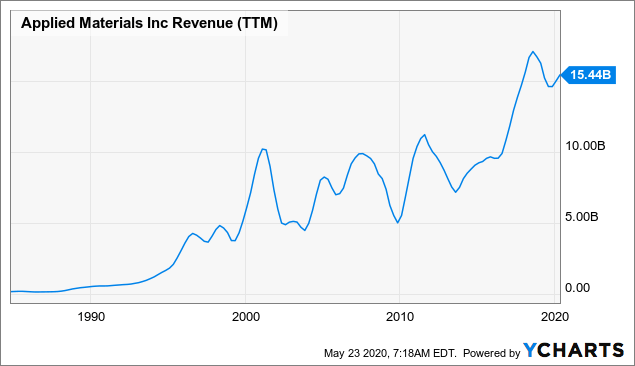
The trailing 12 month revenue progression for AMAT over the last 30 years demonstrates the combination of both cyclical and secular trends in the business.
Data by YCharts
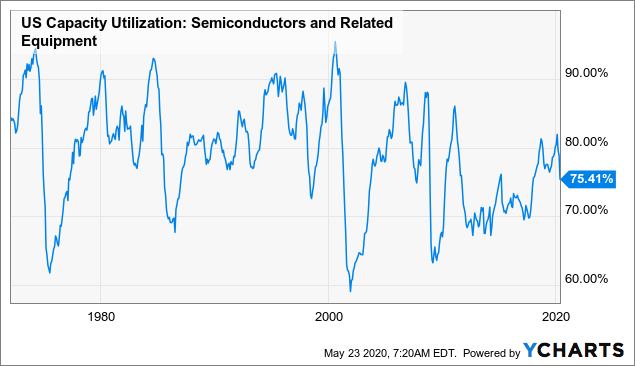
The following chart showing US capacity utilisation of the entire semiconductor and equipment market demonstrates the same phenomenon for the industry as a whole.
Data by YCharts
Looking at these charts alone certainly gives the impression that AMAT's trailing revenues are more likely than not to see a more significant decline in the coming year or two. We can see that in prior extreme cycles, revenues effectively halved from peak.
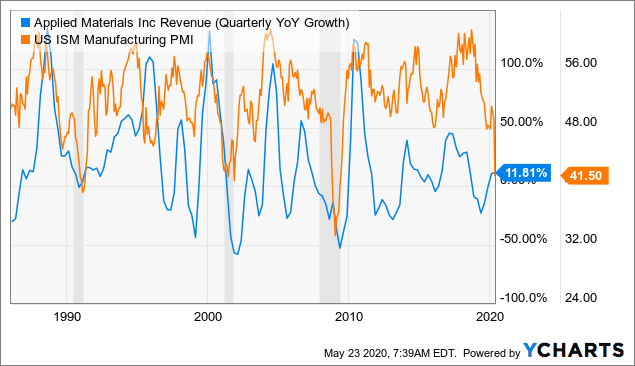
The relationship between y/y revenue growth at AMAT on a quarterly basis with US Manufacturing activity (as measured by the US ISM Manufacturing Index PMI) looks quite tight, particularly on the extreme downturns that coincide with US recessions.
Data by YCharts
This does not bode well for AMAT's revenues in the next 12 months, despite the surprisingly bullish commentary from management in their recent earnings call.
My experience with AMAT management, and in fact the management of all semiconductor equipment companies, is that they are always too bullish at the top of cycles, and then too bearish at the trough. The last time I engaged with AMAT's senior management team was at the height of their "solar" strategy, during which time the CFO could see no risk on the horizon. This was very much the peak of that cycle for AMAT, and the shares suffered badly as estimates started to turn negative and revenues started to fall.
As such, I take management's assertions about the strength of backlog and demand with a very large pinch of salt.
Data by YCharts
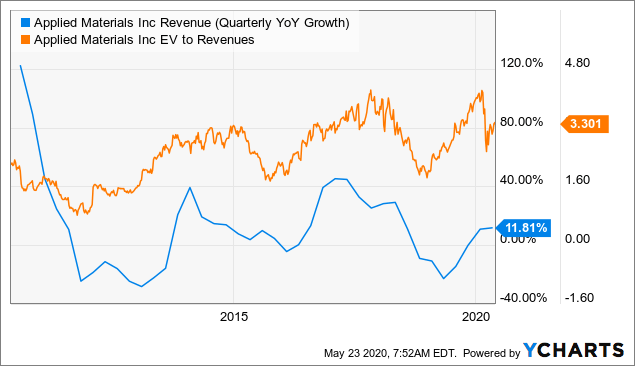
The stock's valuation, as measured by EV/ Sales, has tended to reach its peak after revenue growth has peaked, holding the level for a good 12 months or so before falling sharply by half, reaching a trough around 6 months BEFORE revenue growth has troughed. This is interesting, as the stock clearly LAGS the decline, but then LEADS the recovery.
Given the biological nature of the current recession - a recession not driven by financial excess, so to speak - the current strength in the shares could well be a fairly accurate reflection of how the recession might end towards the end of 2020 as we start to overcome the headwinds from the virus.
The main concern I have here is that the valuation only corrected by half of its usual retracement, so it feels like the odds are 50:50 for a continued recovery or a reversal back to the lows (and then some).
Secular Growth
But underneath the cyclicality lie some powerful secular technological trends that create a foundation of growth over the long-term. Semiconductor capital equipment is fuelled by demand for semiconductor chips which are in turn fuelled by growth in demand for general compute power.
This secular growth is being driven by a number of megatrends, including: artificial intelligence (AI), machine learning (ML) and big data; autonomous vehicles (NYSE:AV), transport-as-a-service (TAAS) and electric/ hybrid vehicles; general automation and robotics; and the Internet-of-things (IOT). I don't intend to conduct a deep dive into these drivers as this topic has been well-trodden. However, this extract from a PWC report in April 2019 sums up the opportunity well:
Demand for chips related to the rapidly growing use of artificial intelligence (AI) will contribute significantly to the industry’s overall growth. Much of that demand is coming from the automotive and industrial markets, the two fastest-growing areas. The automotive market will grow fastest, with a compound annual growth rate (OTC:CAGR) of 11.9% through 2022, due to stronger penetration rates of electric and hybrid autos and the large market potential for autonomous vehicles. Meanwhile, demand for chips in traditional cars remains strong. The industrial market continues to be driven by increasing demand for AI chips and strength in both the security and healthcare sectors. The industrial market overall is expected to grow at an annual CAGR of 10.8% through that period. The communications market will grow by a CAGR of 2.2%, due to the replacement of smartphones, the introduction of 5G technology and growth in emerging markets. Meanwhile, the consumer electronics market will generate about 50% of its revenue from the sales of TVs, video-game consoles and handhelds, and digital set-top boxes until the end of 2022. The consumer electronics market will grow by a CAGR of 6.0% through 2022. Wearables are expected to grow heavily with a CAGR of 21.0%, but the share of wearables within the communications market is only about 10%. Growth in the data processing market, at a CAGR of 2.1%, will stem largely from sales of servers and storage devices. While a year-over-year sales decline of 2.8% is expected for 2019, we anticipate sales will pick up starting in 2020. Although we expect the market for personal computers to decline by a compound annual rate of 5.2% through 2022, that decline will be offset by growth in the Internet of Things (IoT), machine learning and other forms of AI in servers and data centers.
What this means from a component perspective is as follows:
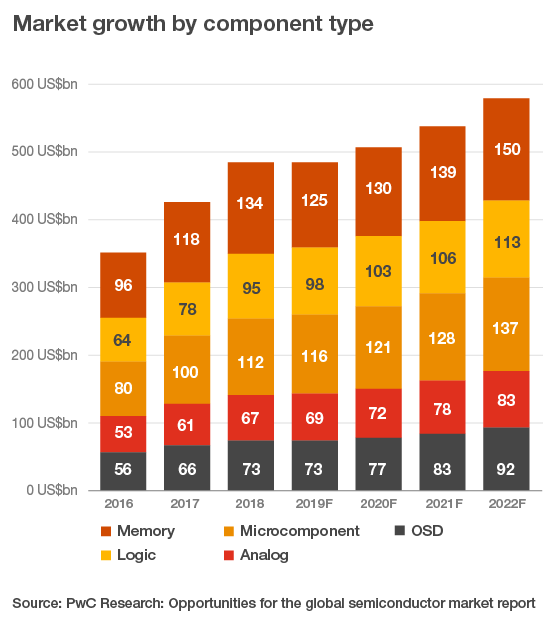
Of course, this report is a year out of date and the outlook will now be impacted by the global Covid-19 pandemic. However, the long-term drivers remain the same in my opinion.
Based on the above chart, PWC are forecasting the following annualised growth in component markets from 2019 to 2022:
| Component Market | 3-Year CAGR |
| Memory | 6.3% |
| Logic | 4.9% |
| Microcomponent | 5.7% |
| Analog | 6.4% |
| OSD (On Screen Display) | 8.0% |
| Total | 6.1% |
Note that the past 3 years has seen the total market grow by 11.2% per annum, according to PWC. This compares to AMAT's annual growth rate of 10.5% - roughly in line with the total end-market growth rate. Historically, AMAT's revenues have grown at an annual average of around 8% since 2004, with some share gains in that time. As such it seems reasonable to assume that AMAT can grow revenues through the cycle at a pace of around 6-7% going forward, if not better.
The question is what happens in the near-term, and of course what that means for the stock.
Balance Sheet and Returns
But before we look at scenarios and valuation, it is worth touching on the quality of this business.
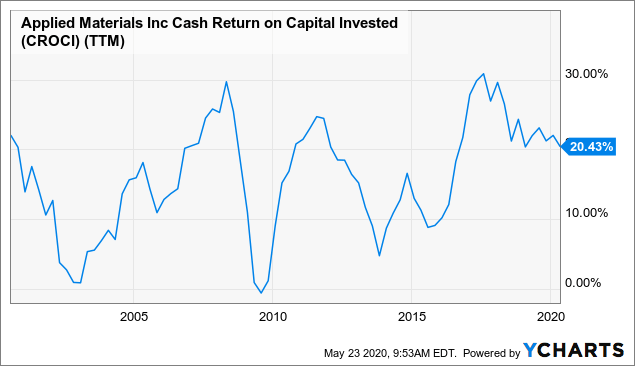
As cyclical as AMAT is, I find the return profile of the business encouraging. Cash return on invested capital (CROCI) has swung between 0% and 30% during cycles, with the long-term average looking to be around 15%. More normal cycles range between 10% and 30%. That's not bad at all for a cyclical business of this nature.
Data by YCharts
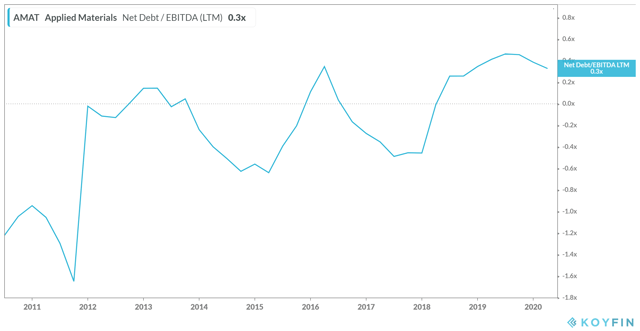
More importantly, the company's balance sheet is in excellent shape. The company's leverage ratio has been managed to near zero or below over the last 2 decades, though this data excludes their LT Investments held on the balance sheet (which reduces the leverage further):
source: Koyfin
The company has seen improving margins over the last 8 years with FCF margins improving despite a tick-up in capital intensity of late (funding innovation).
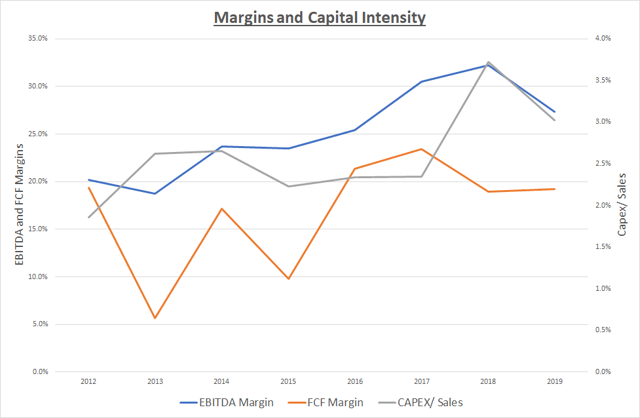
source: own model, Applied Materials Financial Reports
That said, over the very long-term, EBITDA margins have proven to be very cyclical, with current margins bumping up against recent peaks, which once again raises the spectre of near-term cyclical pressures.
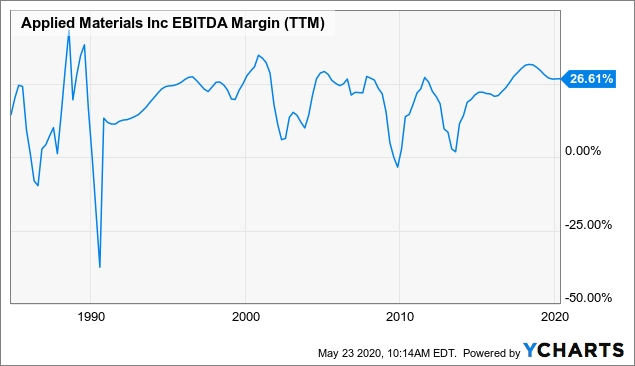
Data by YCharts
The company has deployed capital well over the years, with renewed vigour behind the dividend in recent years (grown roughly 40% per year for 2 years) and a consistent policy on share buybacks (nearly 90% of FCF returned as buyback over 8 years, and close to 100% in the last 5 years).
AMAT has reduced share count from 1.28 billion in 2012 to 945 million in 2019, an annualised rate of decline of 3.7%. I anticipate the company will continue deploying capital in the same way, though dividend growth is likely to be slower from here in my opinion. I expect share count to continue falling at a 3-4% pace.
Downturn Scenario
So now we turn to the near-term outlook. While management seem quite bullish still on the outlook, I am inclined to be more cautious. The CEO made the following comments on their most recent earnings call:
And even when COVID-related effects are taking into account, we still believe that our semiconductor business can deliver strong double digit growth for our fiscal year. In display, we expect our FY 2020 revenues to be close to FY 2019 as the industry navigates the bottom of this spending cycle.
I am modelling a downturn similar to that of 2015, as while the economic downturn is much more severe in nature today, the level of stimulus coordinated on a global basis is simply unprecedented, and with the potential for a biological solution coming at the end of 2020 or early 2021, the prospects of a strong rebound in demand is likely for 2021. I am assuming in this scenario that 2021 will be the trough year in terms of revenues, with a decent rebound from 2022 onwards (October year-end for AMAT).
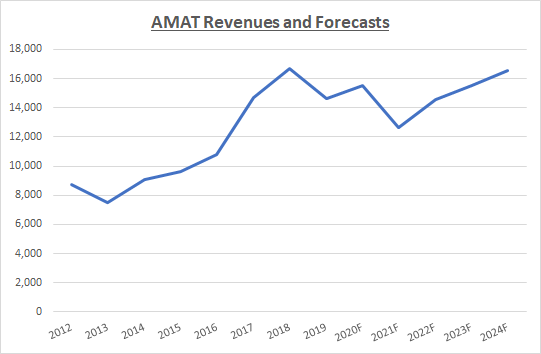
source: own models
Modelling the typical flow-through to EBITDA and thus EPS, with some help from share buybacks to maintain the near-zero leverage ratio, we get the following progression in EBITDA margins and EPS.
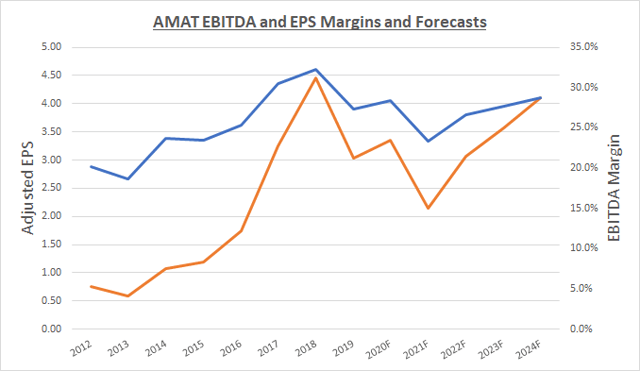
source: own models
In this scenario I have FCF dipping from FY2020's $3 billion to $1.8 billion in FY2021, before returning back to the $3 billion level for the next few years.
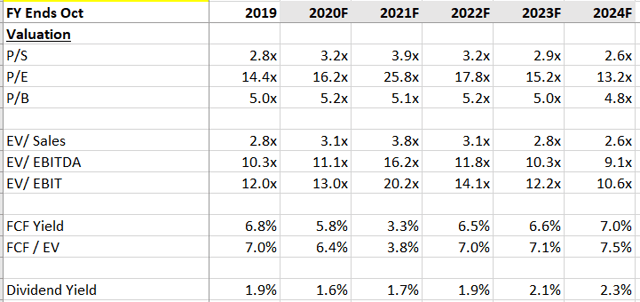
Valuation ratios are as follows:
source: own models
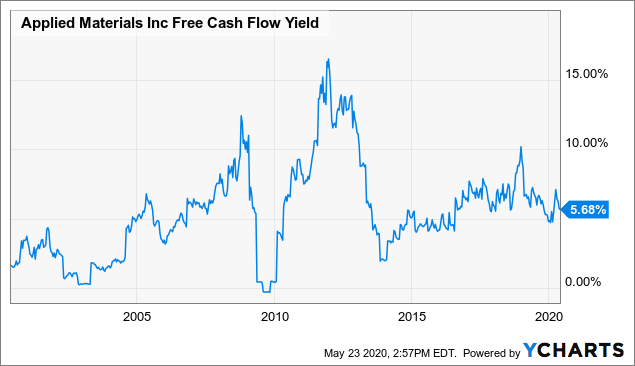
With cyclical names like this, I like to look at historic EV/ Sales and FCF yields, rather than P/E which whips around far too aggressively. In the case of FCF yields, my pessimistic scenario places AMAT at the upper end of historic FCF yield ranges, though the stock can clearly get a lot cheaper if it moves to 10% again.
Data by YCharts
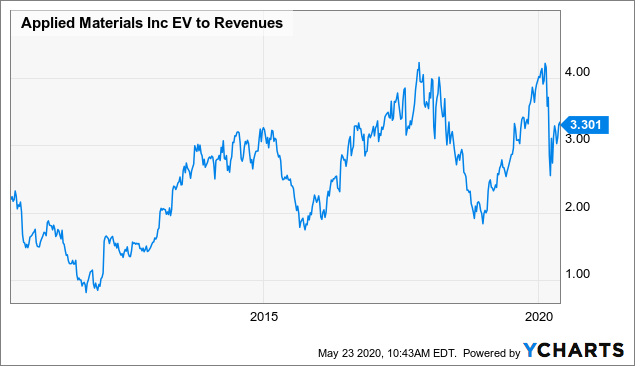
As for EV/ Sales, the historic range has been between 2.0x and 4.0x, with extremes down to 1.0x (coming out of the Global Financial Crisis).
Data by YCharts
Revisiting the EV/ Sales ratio for AMAT over time, we can use the trough multiple on FY2021 revenues and the peak multiple on FY2022 onwards to get a sense of the downside and upside risk to the shares from today.
Using 2.0x at the low end and 4.0x at the high end, I get to downside to around $30 and upside to $70-75. This tallies with terminal multiple analysis using an out-year 5-10% FCF yield and a targeted total return of 10% per annum. Furthermore, on my depressed FY2021 FCF estimate, the $30 downside target represents a 10% FCF yield, which is in line with trough levels.
Recovery Scenario
In this scenario I am taking management's word on the outlook, and taking their (optimistic, in my view) comments on backlog and demand at face value, as per their earnings presentation:
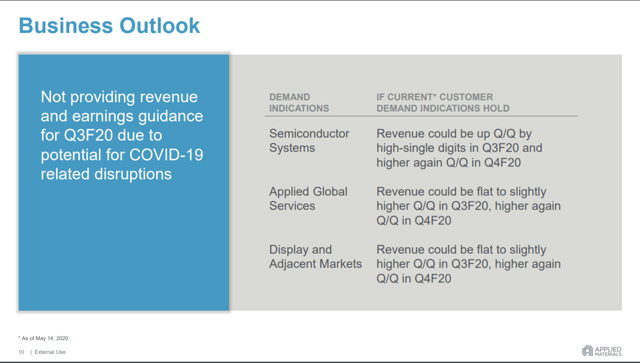
source: AMAT 2Q20 presentation
I arrive at the following revenue, EBITDA and EPS forecasts:
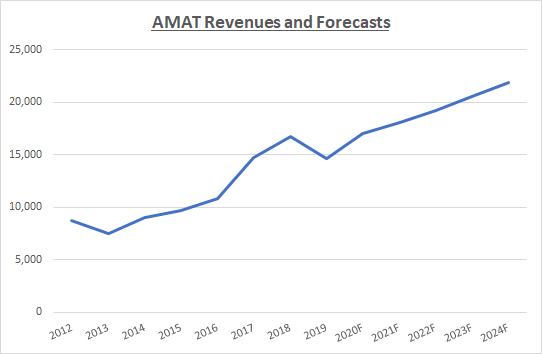
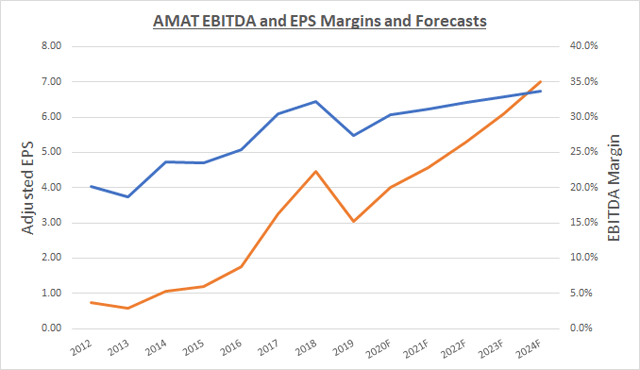
source: own models
FCF climbs, thanks to the absence of a downturn, reaching nearly $5 billion by FY2024.
Valuation ratios are now as follows:
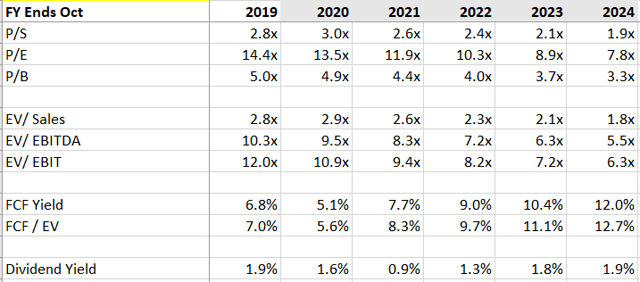
Here FCF yields look much more attractive, particularly as we move out beyond FY2022, as does EV/ Sales.
In this situation, moving to 4.0x revenues in the next few years would lead to a stock price of ~$100. This is significant upside from today's $56.34 and would represent around 5% FCF yields on my out-year estimates - in line with historic ranges.
Using 3.0x as a reasonable mid-cycle downside risk, we get to around $50 in the near-term - not too far from today's price. This would represent a 6-8% FCF yield on near-term FCF, which is in line with recent modest pullbacks.
Conclusion
Putting these scenarios together, we have downside risk to $30-50, and upside opportunity to $70-100.
A reasonable way to frame the outlooks are by assigning probabilities to the paths. The following table takes my own personal view of the probability of each outcome:
| Target Price | Probability |
| $30 | 30% |
| $50 | 30% |
| $70 | 25% |
| $100 | 15% |
| Probability Weighted Target | $56.5 |
In a typically uncanny way, the market seems to be pricing in my probability and scenario assumptions! This often seems to be the case - the market seems very efficient at pricing in near-term sentiment.
In terms of valuation, therefore, AMAT seems to be quite efficiently priced which leaves me to ponder how the probability outcomes might shift. In my view, the probability of the upside increases with the more time that passes, and for long-term investors the $70-100 upside over the next 24 months is more tangible, with further upside thereafter. In fact, based on $70-100 by the end of FY2022, I see potential annualised returns for investors of ~10-25%, excluding dividends.
In general terms, I seek out stocks that can offer me 15% annual returns on investment over a 5 year period or more. As such, I think AMAT shares are worth buying at current levels. However, it would be advisable to leave some firepower for any significant sell-off, which is likely given the lack of visibility in today's market environment.
Buy AMAT and use weakness and volatility to build up long-term positions.
Disclosure: I am/we are long AMAT. I wrote this article myself, and it expresses my own opinions. I am not receiving compensation for it (other than from Seeking Alpha). I have no business relationship with any company whose stock is mentioned in this article.