US Dollar Index Asia Price Forecast: DXY parked below the 100.00 mark
by Flavio Tosti- US Dollar Index (DXY) starts the week little changed unable to overcome the 100.00 figure.
- Support is seen at 99.60 while the major hurdle to the upside is the 100.00 resistance.
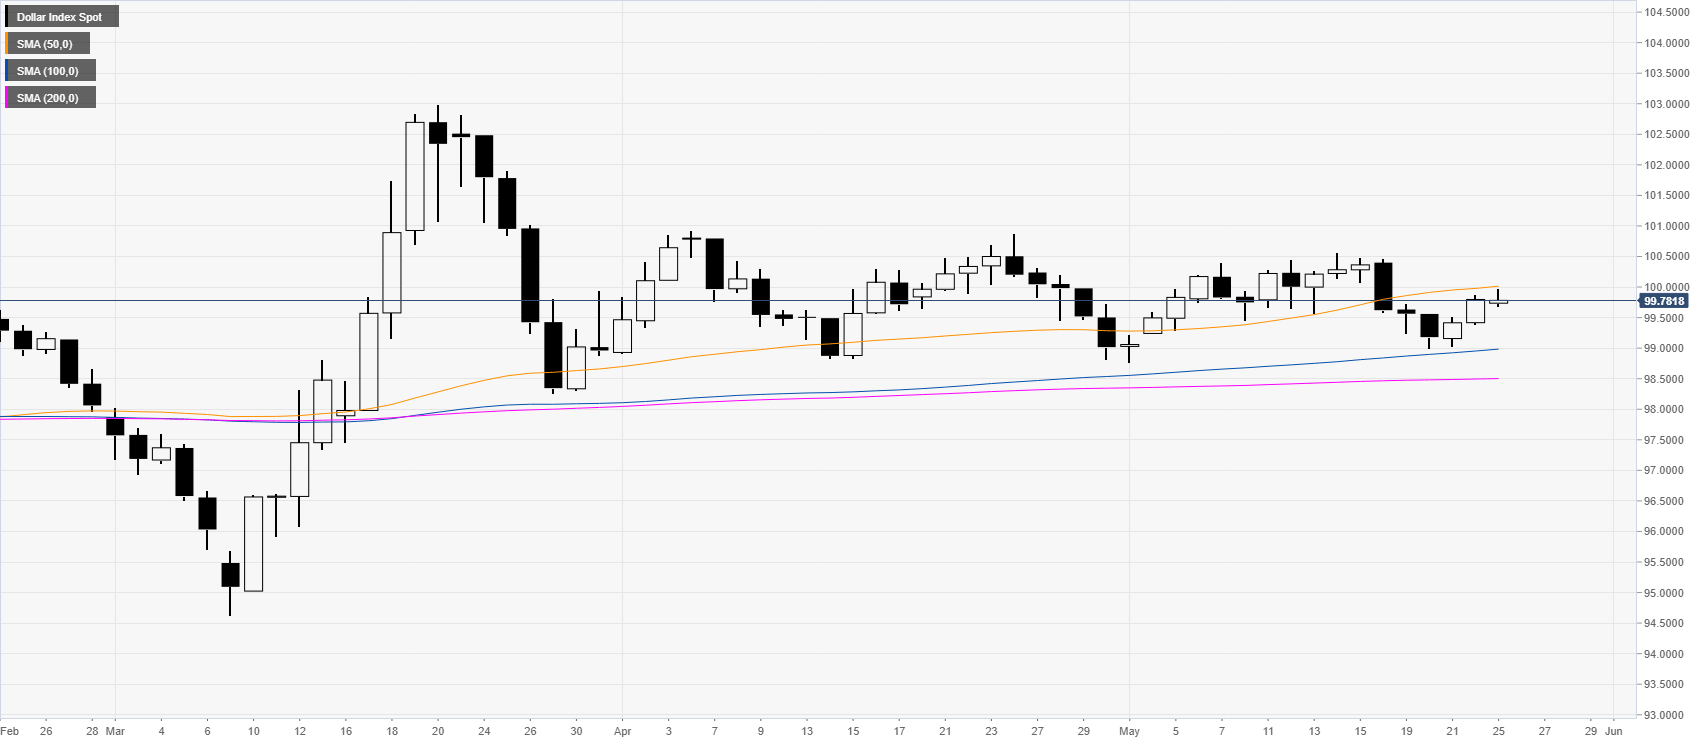
DXY daily chart
The US Dollar Index (DXY) is starting the week with an attempt to retake the 100.00 mark and the 50 SMA. However, Monday’s bulls’ effort has not been successful so far in breaking above the mentioned level.

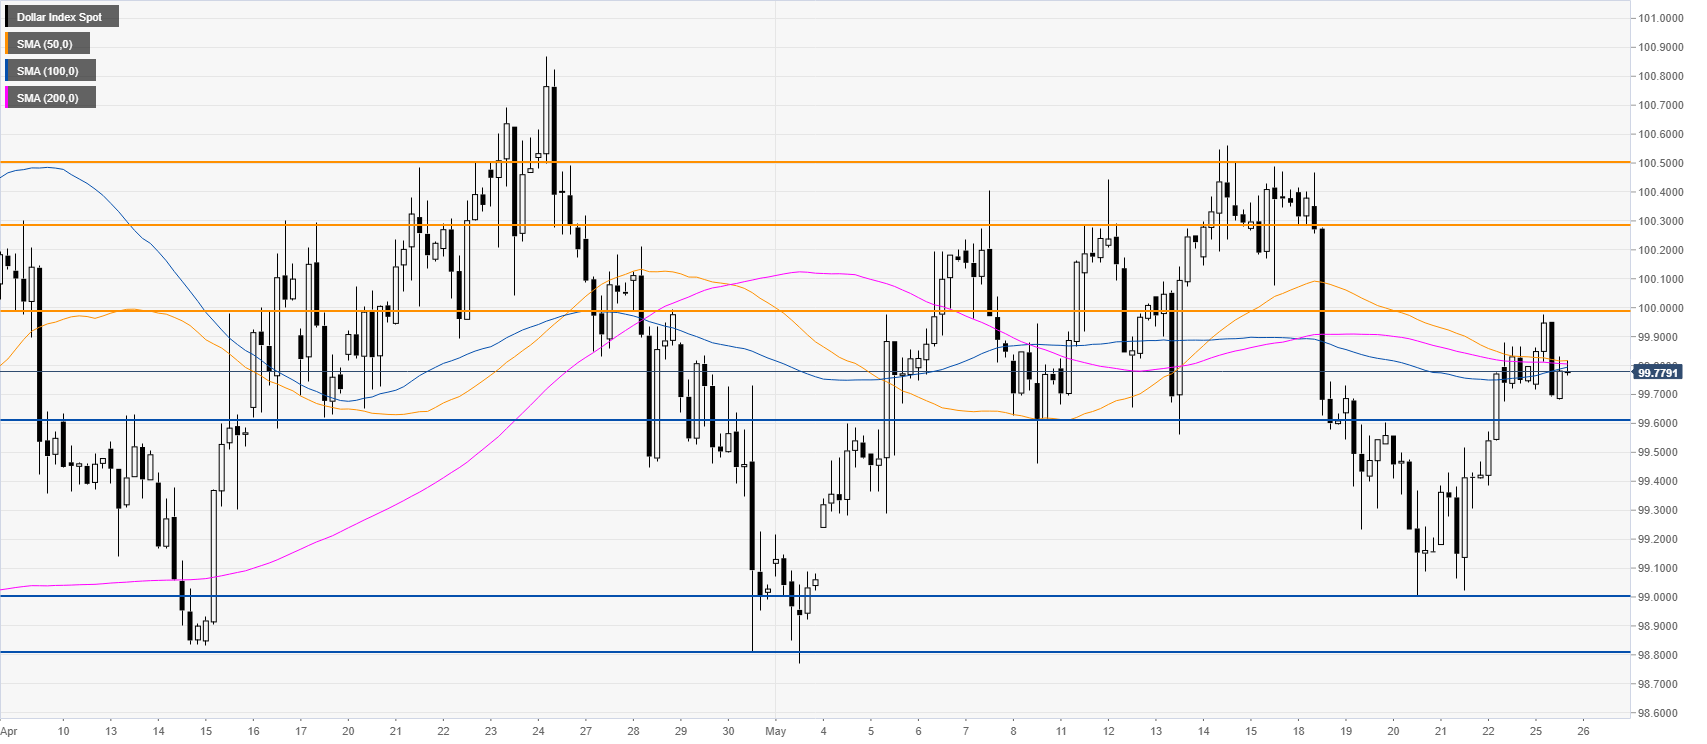
DXY four-hour chart
DXY bounced from the monthly lows while challenging the main SMAs on the four-hour chart. Buyers need a daily close above the 100.00 psychological mark for a possible run to the 100.30/50 resistance zone. However, looking down, market players will be on the lookout for a sustained breakdown below the 99.60 level for a potential retest of the 99.00 figure.

Additional key levels
Dollar Index Spot
| Overview | |
|---|---|
| Today last price | 99.78 |
| Today Daily Change | -0.02 |
| Today Daily Change % | -0.02 |
| Today daily open | 99.8 |
| Trends | |
|---|---|
| Daily SMA20 | 99.77 |
| Daily SMA50 | 99.98 |
| Daily SMA100 | 98.95 |
| Daily SMA200 | 98.49 |
| Levels | |
|---|---|
| Previous Daily High | 99.88 |
| Previous Daily Low | 99.39 |
| Previous Weekly High | 100.47 |
| Previous Weekly Low | 99 |
| Previous Monthly High | 100.93 |
| Previous Monthly Low | 98.81 |
| Daily Fibonacci 38.2% | 99.69 |
| Daily Fibonacci 61.8% | 99.57 |
| Daily Pivot Point S1 | 99.5 |
| Daily Pivot Point S2 | 99.2 |
| Daily Pivot Point S3 | 99 |
| Daily Pivot Point R1 | 99.99 |
| Daily Pivot Point R2 | 100.18 |
| Daily Pivot Point R3 | 100.48 |