EUR/JPY Price Analysis: Euro stays fragile below the 118.00 figure vs. yen
by Flavio Tosti- EUR/JPY remains week at the start of the trading week.
- The level to beat for bears is the 117.25/117.20 price zone.
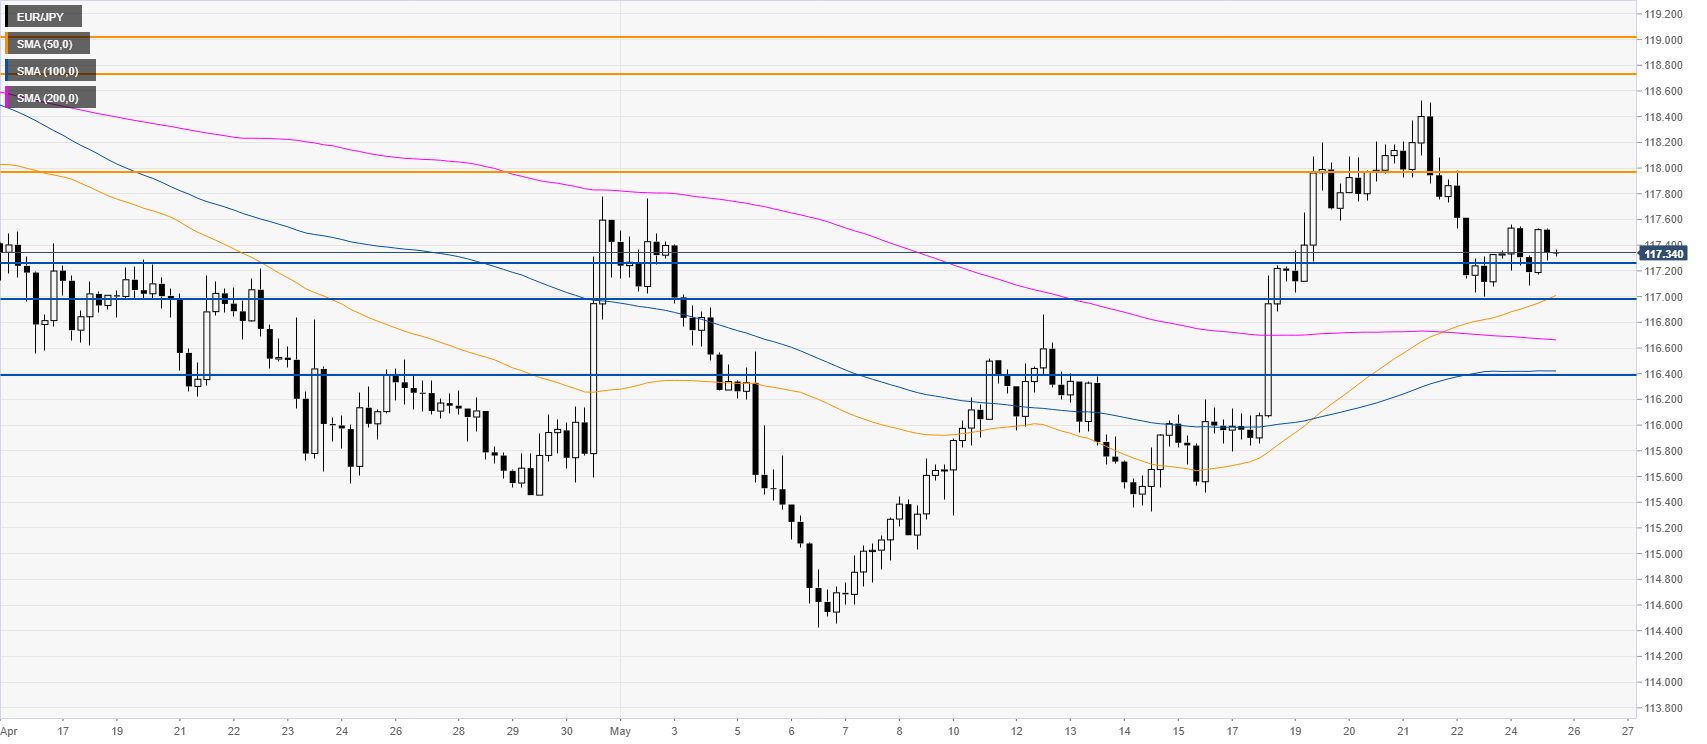
EUR/JPY four-hour chart
EUR/JPY retraced from the May’s highs while trading above the main SMAs on the four-hour chart. The spot lost some bullish momentum as it is challenging the 117.25/117.00 support zone. As the spot remains fragile within an overall bear trend, a break below the mentioned levels can lead to further weakness towards the 116.40 level. On the flip side, occasional bullish attempts should find resistance near the 118.00 level initially.

Resistance: 118.00 118.75, 119.00
Support: 117.25, 117.00, 116.40
Additional key levels
EUR/JPY
| Overview | |
|---|---|
| Today last price | 117.34 |
| Today Daily Change | 0.01 |
| Today Daily Change % | 0.01 |
| Today daily open | 117.33 |
| Trends | |
|---|---|
| Daily SMA20 | 116.41 |
| Daily SMA50 | 117.45 |
| Daily SMA100 | 118.89 |
| Daily SMA200 | 119.3 |
| Levels | |
|---|---|
| Previous Daily High | 117.98 |
| Previous Daily Low | 117 |
| Previous Weekly High | 118.52 |
| Previous Weekly Low | 115.79 |
| Previous Monthly High | 119.04 |
| Previous Monthly Low | 115.45 |
| Daily Fibonacci 38.2% | 117.37 |
| Daily Fibonacci 61.8% | 117.6 |
| Daily Pivot Point S1 | 116.89 |
| Daily Pivot Point S2 | 116.45 |
| Daily Pivot Point S3 | 115.91 |
| Daily Pivot Point R1 | 117.87 |
| Daily Pivot Point R2 | 118.42 |
| Daily Pivot Point R3 | 118.86 |