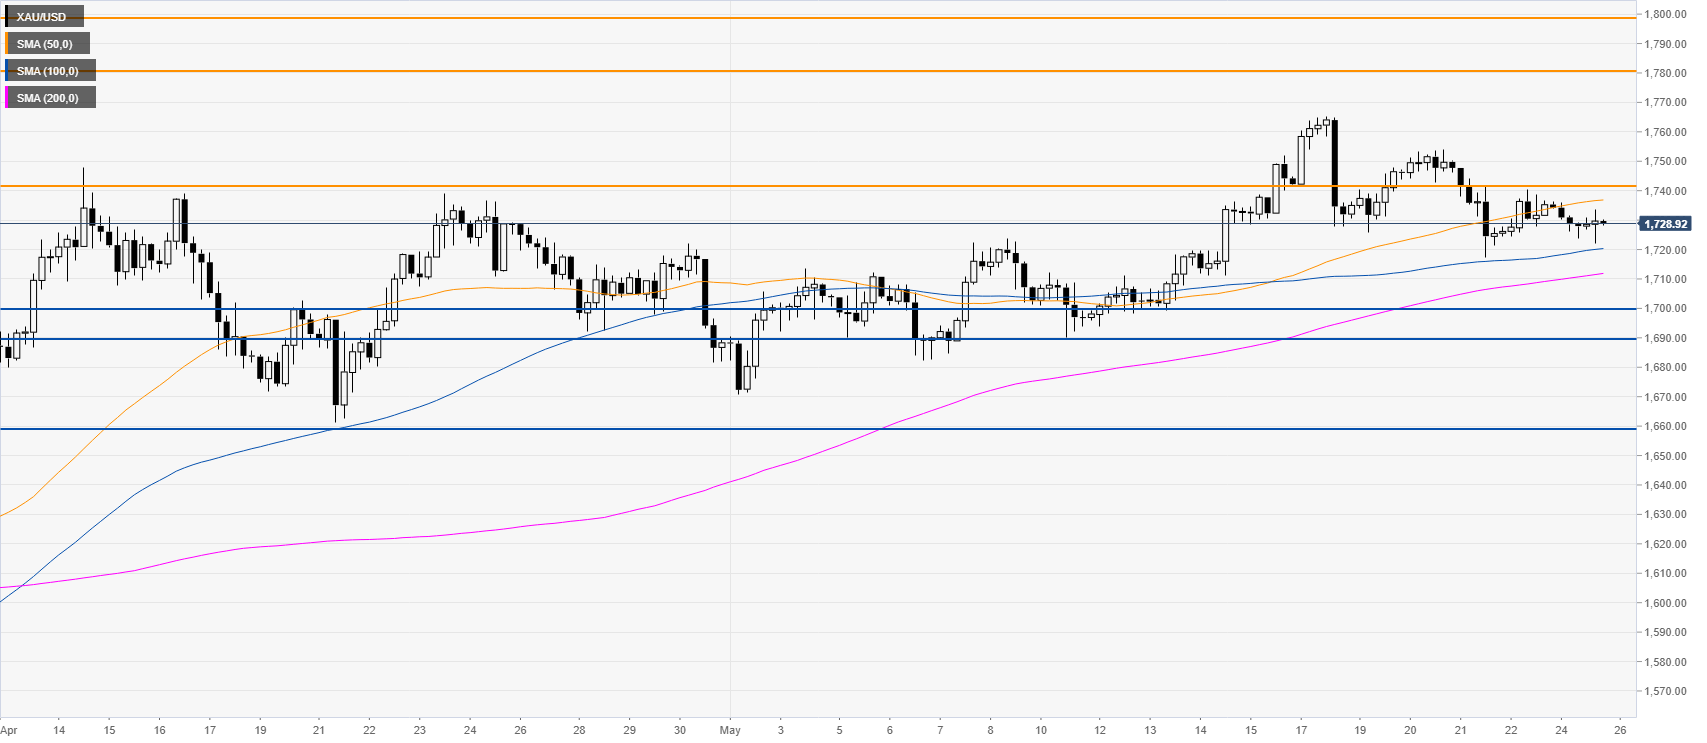
Gold Price Analysis: XAU/USD sideways, trading near $1730/oz
by Flavio Tosti- XAU/USD is consolidating gains at the start of the new trading week.
- The level to beat for bulls is the 1740 resistance.
XAU/USD four-hour chart
XAU/USD is consolidating the recent gains while hovering above $1700 per troy ounce and the main SMAs on the four-hour chart. Gold bulls need a break above the 1740 resistance to move towards the 1780/1800 price zone. Occasional retracements down should find support near the 1690/1700 price zone and the 1660 level.

Additional key levels
XAU/USD
| Overview | |
|---|---|
| Today last price | 1728.77 |
| Today Daily Change | -5.45 |
| Today Daily Change % | -0.31 |
| Today daily open | 1734.22 |
| Trends | |
|---|---|
| Daily SMA20 | 1715.66 |
| Daily SMA50 | 1663.44 |
| Daily SMA100 | 1626.42 |
| Daily SMA200 | 1559.69 |
| Levels | |
|---|---|
| Previous Daily High | 1740.43 |
| Previous Daily Low | 1724.46 |
| Previous Weekly High | 1765.38 |
| Previous Weekly Low | 1717.34 |
| Previous Monthly High | 1747.82 |
| Previous Monthly Low | 1568.46 |
| Daily Fibonacci 38.2% | 1734.33 |
| Daily Fibonacci 61.8% | 1730.56 |
| Daily Pivot Point S1 | 1725.64 |
| Daily Pivot Point S2 | 1717.07 |
| Daily Pivot Point S3 | 1709.67 |
| Daily Pivot Point R1 | 1741.61 |
| Daily Pivot Point R2 | 1749.01 |
| Daily Pivot Point R3 | 1757.58 |