S&P 500 Price Analysis: US stocks en route to the 3000 mark and beyond
by Flavio Tosti- S&P 500 bullish recovery from mid-March stays intact.
- The level to beat for bulls is the 3000 mark.
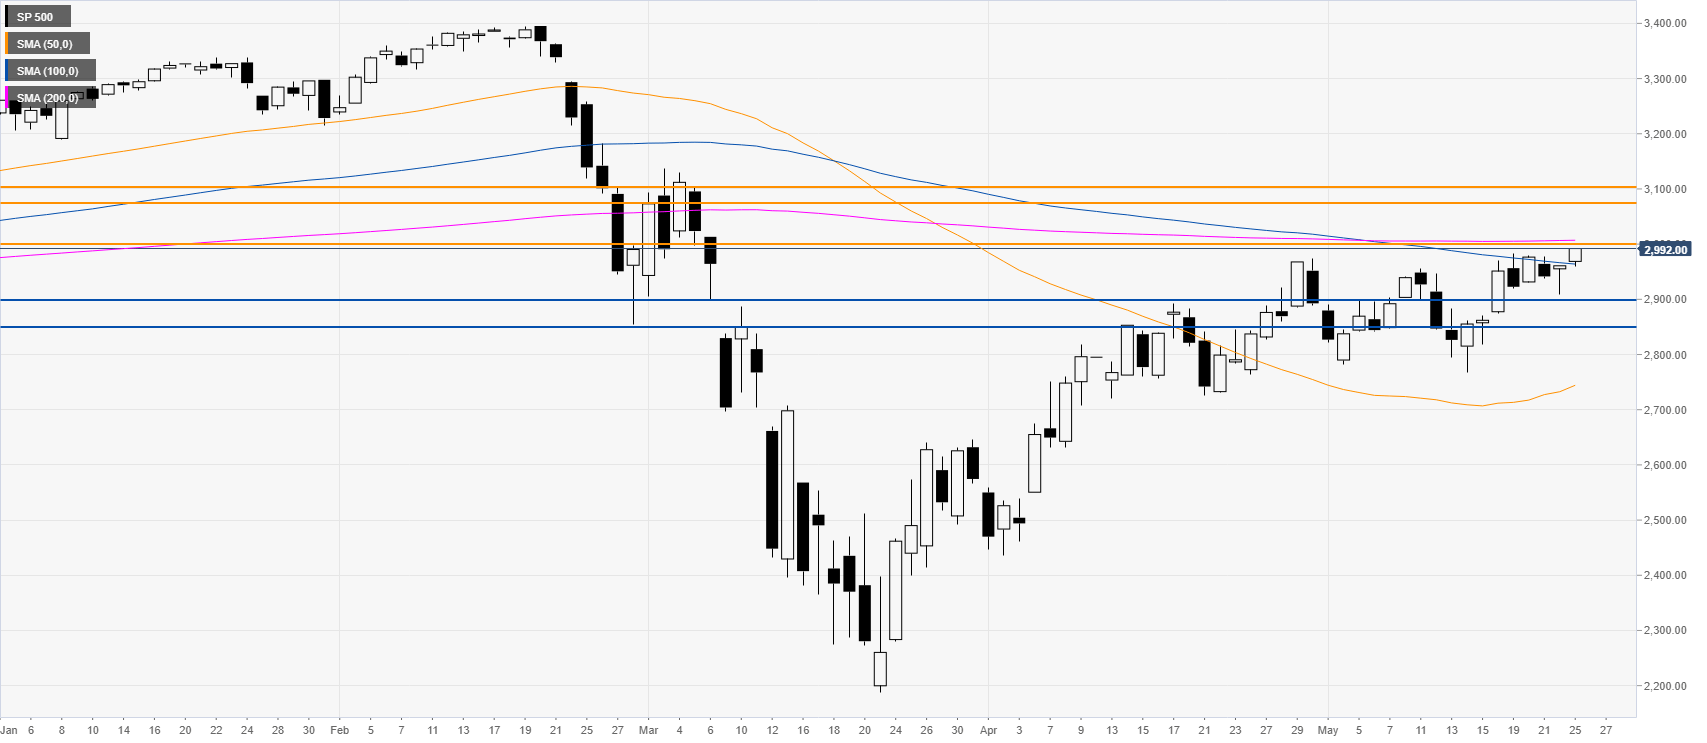
S&P 500 daily chart
After the February-March crash, the S&P 500 has been recovering a great part of its losses. The index is pressuring the May’s highs above the 100 SMA on the daily chart. As buyers stay firmly in charge, a run to the 3000 figure appears imminent. A sustained break above the mentioned level can see the S&P 500 hit the 3075/3100 price zone in the medium-term. On the flip side, support can be seen near the 2900 and 2850 levels.

Additional key levels
SP 500
| Overview | |
|---|---|
| Today last price | 2992.25 |
| Today Daily Change | 31.50 |
| Today Daily Change % | 1.06 |
| Today daily open | 2960.75 |
| Trends | |
|---|---|
| Daily SMA20 | 2894.31 |
| Daily SMA50 | 2732.58 |
| Daily SMA100 | 2966.35 |
| Daily SMA200 | 3006.56 |
| Levels | |
|---|---|
| Previous Daily High | 2961.75 |
| Previous Daily Low | 2908.75 |
| Previous Weekly High | 2982.5 |
| Previous Weekly Low | 2874.5 |
| Previous Monthly High | 2974 |
| Previous Monthly Low | 2436.25 |
| Daily Fibonacci 38.2% | 2941.5 |
| Daily Fibonacci 61.8% | 2929 |
| Daily Pivot Point S1 | 2925.75 |
| Daily Pivot Point S2 | 2890.75 |
| Daily Pivot Point S3 | 2872.75 |
| Daily Pivot Point R1 | 2978.75 |
| Daily Pivot Point R2 | 2996.75 |
| Daily Pivot Point R3 | 3031.75 |