The Chemist's Closed-End Fund Report, May 2020: Thoughts On Our Portfolio Strategy And Why We Stay The Course
by Stanford ChemistSummary
- We warned about overvalued CEFs in February, although we didn't expect the crash to come so quickly and violently.
- My thoughts on our portfolio strategy and why we stay the course.
- Our portfolios have experienced virtually no income drop compared to their share price declines.
- Current discounts are still attractive for the long-term value investor.
- Starting a "weekly flash memo" for members on top picks to buy from our portfolios each week.
Author's note: This article was initially released on May 15, 2020 and data are from that date. Please check latest data before investing.
Chemist's Closed-End Fund Report
Quantitative screens help to rapidly narrow down attractive candidates from the database of 500-plus closed-end funds [CEFs] for further due diligence and investigation. Previous editions of the Report can be searched using the keyword "cefrep."
A database of CEFs was obtained from CEFConnect. All yields are quoted as the yield on price. All z-scores refer to the 1-year z-score, which I consider to be the most useful time duration for profiting from premium/discount reversion. The 1-year z-score is calculated as the difference between the current premium/discount and the 1-year average premium/discount, all divided by the standard deviation of said premium/discount. Positive z-scores indicate that the CEF's current premium/discount is higher than its historical average, while negative z-scores indicate that the current premium/discount is lower than the historical average. Incorporating the standard deviation into the z-score calculation enables comparison between CEFs that may have different magnitudes of absolute premia and discounts.
In the tables, "deviation" refers to the deviation between the current premium/discount of the fund and its 1-year historical premium/discount. "Coverage" refers to the ratio between a fund's earnings and its distribution, with coverage ratios greater than 100% indicating that the fund is earning more than it pays out in distributions.
The coverage ratio is calculated by dividing the earnings/share number provided by CEFConnect on the "distributions" tab by the distribution/share. CEFdata also provides earnings coverage numbers as well. Note a coverage of "0.00%" indicates that earnings numbers were not provided by CEFConnect (usually for MLP funds).
Key to table headings:
P/D = premium/discount
Z = 1-year z-score
Dev = deviation
Lev = leverage
BE = baseline expense
Cov = coverage
Data were taken from the close of May 13, 2020.
1. Top 10 largest premia and top 10 widest discounts
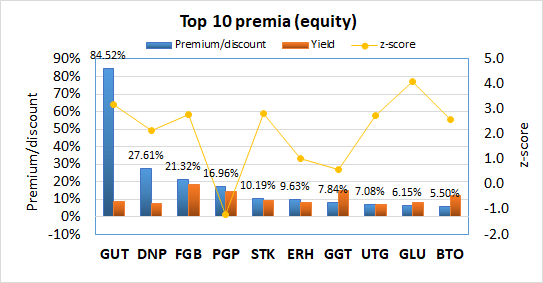
CEFs with the highest discounts are potential buy candidates, while CEFs with the highest premia are potential sell/short candidates. The following data show the 10 CEFs with the highest premia and 10 CEFs with the highest discounts. Yields, z-scores and leverage are shown for comparison.
Top 10 largest premia equity:
| Ticker | Fund | Category | P/D | Y | Z | Cov | 1Y NAV | Dev | Lev | BE |
| (GUT) | Gabelli Utility Trust | Sector Equity | 84.52% | 8.84% | 3.2 | 1% | -10.08% | 32.76% | 33% | 1.76% |
| (DNP) | DNP Select Income | Sector Equity | 27.61% | 7.49% | 2.2 | 25% | -5.97% | 7.86% | 28% | 1.01% |
| (FGB) | First Trust Spec Finance & Fincl Opp | Sector Equity | 21.32% | 18.24% | 2.8 | 33% | -52.88% | 17.24% | 40% | 1.60% |
| (PGP) | PIMCO Global StocksPLUS & Income | Global Allocation | 16.96% | 14.31% | -1.2 | 113% | -20.83% | -6.19% | 40% | 1.54% |
| (STK) | Columbia Seligman Premium Technology Gr | Covered Call | 10.19% | 9.00% | 2.8 | -1% | -5.66% | 7.64% | 0% | 1.15% |
| (ERH) | Wells Fargo Util & High In | U.S. Allocation | 9.63% | 8.10% | 1.0 | 40% | -4.92% | 5.10% | 18% | 1.04% |
| (GGT) | Gabelli Multimedia | Sector Equity | 7.84% | 14.86% | 0.6 | 2% | -22.23% | 2.50% | 41% | 1.79% |
| (UTG) | Reaves Utility Income | Sector Equity | 7.08% | 7.20% | 2.7 | 20% | -9.20% | 6.21% | 24% | 1.17% |
| (GLU) | Gabelli Global Utility & Income | Sector Equity | 6.15% | 7.80% | 4.1 | -26% | -17.75% | 11.67% | 44% | 1.33% |
| (BTO) | JHancock Financial Opportunities | Sector Equity | 5.50% | 12.17% | 2.6 | 7% | -32.91% | 6.89% | 26% | 1.62% |

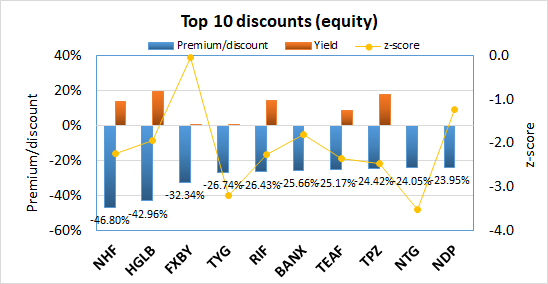
Top 10 widest discounts equity:
| Ticker | Fund | Category | P/D | Y | Z | Cov | 1Y NAV | Dev | Lev | BE |
| (NHF) | NexPoint Strategic Opportunities Fund | U.S. Allocation | -46.80% | 13.75% | -2.2 | 60% | -25.02% | -25.32% | 30% | 2.03% |
| (HGLB) | Highland Global Allocation Fund | Global Allocation | -42.96% | 19.16% | -1.9 | 44% | -29.90% | -17.31% | 47% | 0.83% |
| (OTCPK:FXBY) | FOXBY CORP | U.S. Equity | -32.34% | 0.62% | 0.0 | #DIV/0! | -20.75% | -0.19% | 22% | 2.42% |
| (TYG) | Tortoise Energy Infrastructure Corp. | MLPs | -26.74% | 0.00% | -3.2 | 52% | -73.52% | -20.90% | 70% | 3.64% |
| (RIF) | RMR Real Estate Income Fund | Real Estate | -26.43% | 14.12% | -2.3 | -7% | -28.91% | -6.17% | 41% | 1.67% |
| (BANX) | STONECASTLE FINANCIAL CORP | Sector Equity | -25.66% | -1.8 | #DIV/0! | 6.41% | -21.83% | 0% | 3.40% | |
| (TEAF) | Tortoise Essential Assets Income Term | Sector Equity | -25.17% | 8.78% | -2.3 | 27% | -24.08% | -14.66% | 0% | 1.26% |
| (TPZ) | Tortoise Power and Energy Infrastructure | U.S. Allocation | -24.42% | 17.79% | -2.5 | 153% | -40.64% | -13.66% | 42% | 1.76% |
| (NTG) | Tortoise Midstream Energy Fund | MLPs | -24.05% | 0.00% | -3.5 | 54% | -82.30% | -17.18% | 77% | 1.70% |
| (NDP) | Tortoise Energy Independence Fund, Inc | Sector Equity | -23.95% | 0.00% | -1.2 | 206% | -70.95% | -18.90% | 48% | 2.02% |

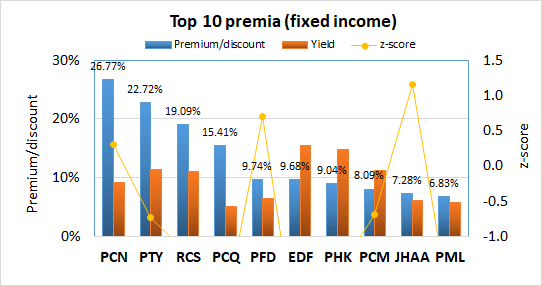
Top 10 largest premia fixed income:
| Ticker | Fund | Category | P/D | Y | Z | Cov | 1Y NAV | Dev | Lev | BE |
| (PCN) | PIMCO Corporate & Income Strgy | Investment Grade | 26.77% | 9.19% | 0.3 | 80% | -11.51% | 2.25% | 32% | 0.94% |
| (PTY) | PIMCO Corporate & Income Opportunity Fd | Investment Grade | 22.72% | 11.36% | -0.7 | 83% | -13.51% | -4.07% | 28% | 0.80% |
| (RCS) | PIMCO Strategic Income Fund | Investment Grade | 19.09% | 11.09% | -1.2 | 114% | -11.44% | -12.07% | 51% | 0.98% |
| (PCQ) | PIMCO CA Municipal Income | California Munis | 15.41% | 5.15% | -2.0 | 80% | -0.87% | -17.23% | 49% | 1.15% |
| (PFD) | Flaherty & Crumrine Preferred Income | Preferreds | 9.74% | 6.51% | 0.7 | 97% | -0.31% | 2.87% | 36% | 1.29% |
| (EDF) | Stone Harbor Emerg. Mkts Income Fund | Emerging Market Income | 9.68% | 15.41% | -2.8 | 78% | -34.30% | -30.24% | 9% | 1.59% |
| (PHK) | PIMCO High Income | Multisector Income | 9.04% | 14.84% | -1.5 | 73% | -16.05% | -12.19% | 36% | 0.91% |
| (PCM) | PCM Fund | Limited Duration | 8.09% | 11.20% | -0.7 | 86% | -12.94% | -3.36% | 45% | 1.43% |
| (JHAA) | Nuveen High Income 2023 Target Term Fund | High Yield | 7.28% | 6.10% | 1.2 | 111% | -9.22% | 4.73% | 28% | 1.07% |
| (PML) | PIMCO Municipal Income II | National Munis | 6.83% | 5.85% | -2.0 | 92% | -2.34% | -13.44% | 49% | 1.06% |

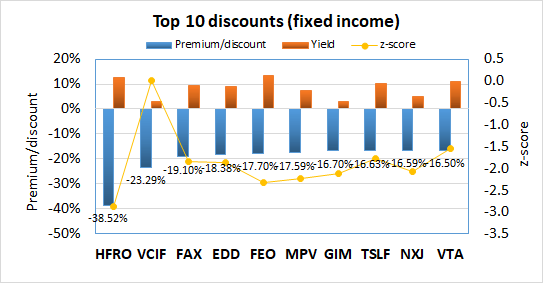
Top 10 widest discounts fixed income:
| Ticker | Fund | Category | P/D | Y | Z | Cov | 1Y NAV | Dev | Lev | BE |
| (HFRO) | Highland Floating Rate Opportunities Fd | Senior Loans | -38.52% | 12.71% | -2.9 | 74% | -14.07% | -25.63% | 40% | 1.80% |
| (VCIF) | Vertical Capital Income Fund | Senior Loans | -23.29% | 3.16% | 0.0 | 84% | 0.00% | #VALUE! | 2% | 2.88% |
| (FAX) | Aberdeen Asia-Pacific Income Fund Inc | Global Income | -19.10% | 9.51% | -1.8 | 55% | -3.93% | -5.15% | 35% | 1.22% |
| (EDD) | Morgan Stanley Emrgng Mkts Domestic Debt | Emerging Market Income | -18.38% | 9.09% | -1.9 | 31% | -6.71% | -6.66% | 27% | 1.67% |
| (FEO) | First Trust/Aberdeen Emerging Opp | Emerging Market Income | -17.70% | 13.43% | -2.3 | 17% | -9.87% | -6.83% | 8% | 1.73% |
| (MPV) | Barings Participation Invs | High Yield | -17.59% | 7.47% | -2.2 | 28% | 3.47% | -31.91% | 7% | 2.33% |
| (GIM) | Templeton Global Income | Global Income | -16.70% | 2.93% | -2.1 | 223% | -6.98% | -5.91% | 0% | 0.67% |
| (TSLF) | THL Credit Senior Loan Fund | Senior Loans | -16.63% | 10.25% | -1.8 | 95% | -15.69% | -4.38% | 32% | 1.55% |
| (NXJ) | Nuveen NJ Quality Muni Inc | Single-state Munis | -16.59% | 4.80% | -2.1 | 106% | -0.34% | -4.04% | 40% | 0.00% |
| (VTA) | Invesco Dynamic Credit Opp | Senior Loans | 16.50% | 10.94% | 1.5 | 96% | -18.07% | -4.53% |

2. Top 10 highest z-scores and top 10 lowest z-scores
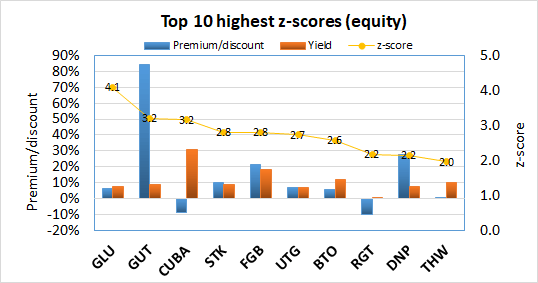
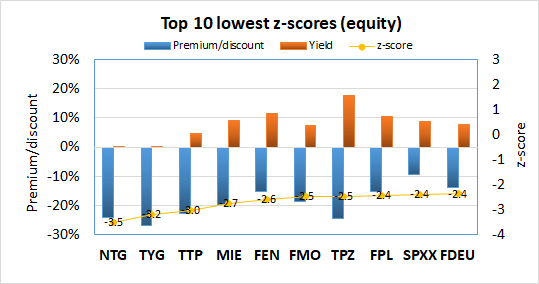
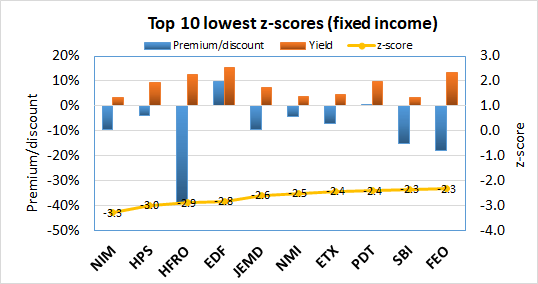
Similar to premia/discounts, CEFs with the lowest z-scores are potential buy candidates, while CEFs with the highest z-scores are potential sell/short candidates. The following data show the 10 CEFs with the highest z-scores and 10 CEFs with the lowest z-scores. Premium/discount, yields and leverage are shown for comparison.
Top 10 highest z-scores equity:
| Ticker | Fund | Category | Z | P/D | Y | Cov | 1Y NAV | Dev | Lev | BE |
| (GLU) | Gabelli Global Utility & Income | Sector Equity | 4.1 | 6.15% | 7.80% | -26% | -17.75% | 11.67% | 44% | 1.33% |
| (GUT) | Gabelli Utility Trust | Sector Equity | 3.2 | 84.52% | 8.84% | 1% | -10.08% | 32.76% | 33% | 1.76% |
| (CUBA) | Herzfeld Caribbean Basin | U.S. Equity | 3.2 | -8.88% | 30.70% | -2% | -30.78% | 7.12% | 0% | 2.65% |
| (STK) | Columbia Seligman Premium Technology Gr | Covered Call | 2.8 | 10.19% | 9.00% | -1% | -5.66% | 7.64% | 0% | 1.15% |
| (FGB) | First Trust Spec Finance & Fincl Opp | Sector Equity | 2.8 | 21.32% | 18.24% | 33% | -52.88% | 17.24% | 40% | 1.60% |
| (UTG) | Reaves Utility Income | Sector Equity | 2.7 | 7.08% | 7.20% | 20% | -9.20% | 6.21% | 24% | 1.17% |
| (BTO) | JHancock Financial Opportunities | Sector Equity | 2.6 | 5.50% | 12.17% | 7% | -32.91% | 6.89% | 26% | 1.62% |
| (RGT) | Royce Global ValueTrust Fund | Global Equity | 2.2 | -10.11% | 0.60% | -1% | -7.13% | 4.51% | 6% | 1.01% |
| (DNP) | DNP Select Income | Sector Equity | 2.2 | 27.61% | 7.49% | 25% | -5.97% | 7.86% | 28% | 1.01% |
| (THW) | Tekla World Healthcare Fund | Sector Equity | 2.0 | 0.51% | 10.03% | 4% | 15.13% | 5.95% | 22% | 1.60% |

Top 10 lowest z-scores equity:
| Ticker | Fund | Category | Z | P/D | Y | Cov | 1Y NAV | Dev | Lev | BE |
| (NTG) | Tortoise Midstream Energy Fund | MLPs | -3.5 | -24.05% | 0.00% | n/a | -82.30% | -17.18% | 77% | 1.70% |
| (TYG) | Tortoise Energy Infrastructure Corp. | MLPs | -3.2 | -26.74% | 0.00% | n/a | -73.52% | -20.90% | 70% | 3.64% |
| (TTP) | Tortoise Pipeline & Energy | MLPs | -3.0 | -22.62% | 4.62% | 86% | -69.26% | -10.97% | 57% | 1.91% |
| (MIE) | Cohen & Steers MLP Income and Energy Opp | MLPs | -2.7 | -19.75% | 9.23% | -46% | -70.25% | -20.26% | 60% | 1.80% |
| (FEN) | First Trust Energy Income And Growth | MLPs | -2.6 | -15.19% | 11.44% | -4% | -32.98% | -15.69% | 36% | 1.53% |
| (FMO) | Fiduciary-Claymore Energy Infrastructure | MLPs | -2.5 | -18.80% | 7.34% | 0% | -75.64% | -10.55% | 69% | 1.84% |
| (TPZ) | Tortoise Power and Energy Infrastructure | U.S. Allocation | -2.5 | -24.42% | 17.79% | 153% | -40.64% | -13.66% | 42% | 1.76% |
| (FPL) | First Trust New Opps MLP & Energy Fund | MLPs | -2.4 | -15.39% | 10.64% | -63% | -42.35% | -7.67% | 40% | 1.59% |
| (SPXX) | Nuveen S&P 500 Dynamic Overwrite | Covered Call | -2.4 | -9.48% | 8.74% | 6% | -8.35% | -9.23% | 0% | 0.99% |
| (FDEU) | First Trust Dynamic Europe Equity Income | Global Equity | -2.4 | -13.95% | 7.78% | 55% | -22.32% | -6.02% | 35% | 0.00% |

Top 10 highest z-scores fixed income:
| Ticker | Fund | Category | Z | P/D | Y | Cov | 1Y NAV | Dev | Lev | BE |
| (BQH) | BlackRock NY Municipal Bond | New York Munis | 2.9 | -2.03% | 3.81% | 103% | -1.48% | 5.60% | 42% | 1.56% |
| (NMS) | Nuveen MN Quality Muni Inc | Single-state Munis | 2.5 | -4.45% | 3.87% | 0% | -2.05% | 4.26% | 39% | 1.16% |
| (BKT) | BlackRock Income | Investment Grade | 2.2 | -2.81% | 6.68% | 61% | 7.71% | 2.57% | 30% | 0.94% |
| (MQY) | BlackRock Muniyield Quality | National Munis | 1.7 | -4.51% | 4.39% | 103% | -1.76% | 3.28% | 40% | 0.94% |
| (MCR) | MFS® Charter Income | High Yield | 1.6 | -4.08% | 8.26% | 54% | 2.12% | 3.72% | 21% | 0.70% |
| (DMF) | BNY Mellon Municipal Income | National Munis | 1.6 | 0.03% | 4.97% | 97% | -3.76% | 4.90% | 40% | 0.85% |
| (MNE) | BlackRock Muni New York Interm Duration | New York Munis | 1.6 | -0.92% | 2.99% | 104% | -1.85% | 4.25% | 41% | 1.43% |
| (IGI) | Western Asset Invstm Grd Dfnd Opp Tr Inc | Investment Grade | 1.5 | 5.55% | 4.04% | 101% | 5.04% | 4.18% | 0% | 0.78% |
| (PIM) | Putnam Master Interm Income | Investment Grade | 1.4 | 0.50% | 8.57% | 61% | -5.93% | 4.11% | 0% | 1.02% |
| (EGF) | BlackRock Enhanced Government | Investment Grade | 1.4 | -2.37% | 3.71% | 71% | 3.85% | 1.52% | 20% | 1.15% |

Top 10 lowest z-scores fixed income:
| Ticker | Fund | Category | Z | P/D | Y | Cov | 1Y NAV | Dev | Lev | BE |
| (NIM) | Nuveen Select Maturity Muni | National Munis | -3.3 | -9.60% | 3.36% | 97% | 0.77% | -5.95% | 0% | 0.57% |
| (HPS) | JHancock Preferred Income III | Preferreds | -3.0 | -3.74% | 9.23% | 96% | -11.24% | -5.49% | 39% | 1.26% |
| (HFRO) | Highland Floating Rate Opportunities Fd | Senior Loans | -2.9 | -38.52% | 12.71% | 74% | -14.07% | -25.63% | 40% | 1.80% |
| (EDF) | Stone Harbor Emerg. Mkts Income Fund | Emerging Market Income | -2.8 | 9.68% | 15.41% | 78% | -34.30% | -30.24% | 9% | 1.59% |
| (JEMD) | Nuveen Emrg Mkts Debt 2022 Target Term | Emerging Market Income | -2.6 | -9.40% | 7.31% | 123% | -22.73% | -8.68% | 33% | 1.41% |
| (NMI) | Nuveen Municipal Income | National Munis | -2.5 | -4.27% | 3.88% | 106% | -1.33% | -4.36% | 3% | 0.79% |
| (ETX) | EV Municipal Income 2028 Term Trust | National Munis | -2.4 | -7.22% | 4.47% | 92% | 1.31% | -5.59% | 37% | 1.04% |
| (PDT) | JHancock Premium Dividend Fund | Preferreds | -2.4 | 0.28% | 9.99% | 58% | -13.80% | -9.88% | 40% | 1.41% |
| (SBI) | Western Asset Intermediate Muni | National Munis | -2.3 | -14.92% | 3.47% | 107% | -3.25% | -3.63% | 26% | 1.76% |
| (FEO) | First Trust/Aberdeen Emerging Opp | Emerging Market Income | -2.3 | -17.70% | 13.43% | 17% | -9.87% | -6.83% | 8% | 1.73% |

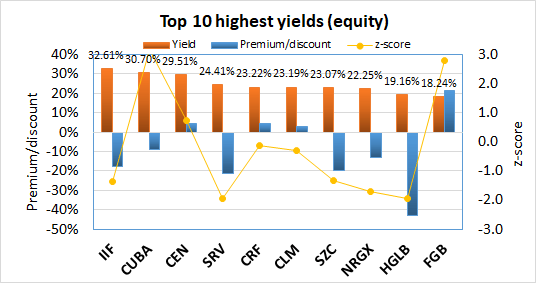
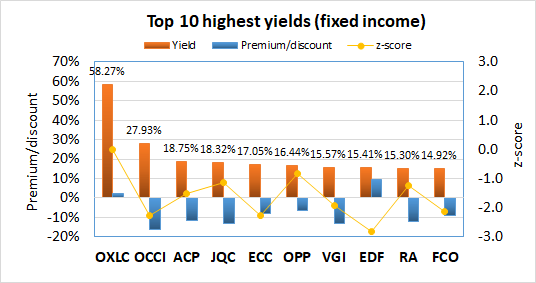
3. Top 10 highest yielding CEFs
Some readers are mostly interested in obtaining income from their CEFs, so the following data presents the top 10 highest yielding CEFs. I've also included the premium/discount and z-score data for reference. Before going out and buying all 10 funds from the list, some words of caution: [i] higher yields generally indicate higher risk, [ii] some of these funds trade at a premium, meaning you will be buying them at a price higher than the intrinsic value of the assets (which is why I've included the premium/discount and z-score data for consideration), and [iii] beware of funds paying out high yields from return of capital in a destructive manner.
Top 10 highest yields equity:
| Ticker | Fund | Category | Y | P/D | Z | Cov | 1Y NAV | Dev | Lev | BE |
| (IIF) | Morgan Stanley India Investment | Asia Equity | 32.61% | -17.48% | -1.4 | 39% | -25.34% | -3.01% | 0% | 1.28% |
| (CUBA) | Herzfeld Caribbean Basin | U.S. Equity | 30.70% | -8.88% | 3.2 | -2% | -30.78% | 7.12% | 0% | 2.65% |
| (CEN) | Center Coast Brookfield MLP & NRG Inf Fd | MLPs | 29.51% | 4.28% | 0.7 | -48% | -80.99% | 3.91% | 72% | 2.66% |
| (SRV) | Cushing® MLP & Infras Total Return | MLPs | 24.41% | -21.27% | -1.9 | 54% | -45.67% | -9.77% | 42% | 2.37% |
| (CRF) | Cornerstone Total Return Fund | U.S. Equity | 23.22% | 4.52% | -0.1 | 3% | -0.18% | -0.52% | 10% | 1.17% |
| (CLM) | Cornerstone Strategic Value | U.S. Equity | 23.19% | 3.13% | -0.3 | 2% | 1.27% | -1.46% | 0% | 1.13% |
| (SZC) | Cushing® NextGen Infrastructure Income | Sector Equity | 23.07% | -19.65% | -1.3 | 17% | -41.52% | -5.78% | 12% | 1.89% |
| (NRGX) | PIMCO Energy & Tactical Credit Opps | Global Allocation | 22.25% | -12.91% | -1.7 | 17% | -53.09% | -8.67% | 0% | 2.29% |
| (HGLB) | Highland Global Allocation Fund | Global Allocation | 19.16% | -42.96% | -1.9 | 44% | -29.90% | -17.31% | 47% | 0.83% |
| (FGB) | First Trust Spec Finance & Fincl Opp | Sector Equity | 18.24% | 21.32% | 2.8 | 33% | -52.88% | 17.24% | 40% | 1.60% |

Top 10 highest yields fixed income:
| Ticker | Fund | Category | Y | P/D | Z | Cov | 1Y NAV | Dev | Lev | BE |
| (OXLC) | Oxford Lane Capital Corp | Senior Loans | 58.27% | 2.24% | 0.0 | 84% | -3.48% | -18.93% | 25% | 8.80% |
| (OCCI) | OFS Credit Company Inc | Senior Loans | 27.93% | -16.45% | -2.3 | 74% | -16.40% | -12.06% | 32% | 7.37% |
| (ACP) | Aberdeen Income Credit Strategies Fund | Senior Loans | 18.75% | -11.49% | -1.5 | 65% | -26.88% | -6.23% | 39% | 2.28% |
| (JQC) | Nuveen Credit Strategies Income Fund | Senior Loans | 18.32% | -13.16% | -1.1 | 38% | -11.43% | -3.61% | 42% | 1.34% |
| (ECC) | Eagle Point Credit Company LLC | Senior Loans | 17.05% | -7.98% | -2.3 | 125% | -18.85% | -33.86% | 38% | 5.82% |
| (OPP) | RiverNorth/DoubleLine Strategic Opp Fund | High Yield | 16.44% | -6.59% | -0.8 | 42% | -11.33% | -2.21% | 28% | 1.92% |
| (VGI) | Virtus Global Multi-Sector Income Fund | Multisector Income | 15.57% | -13.35% | -1.9 | 36% | -6.14% | -7.87% | 31% | 1.76% |
| (EDF) | Stone Harbor Emerg. Mkts Income Fund | Emerging Market Income | 15.41% | 9.68% | -2.8 | 78% | -34.30% | -30.24% | 9% | 1.59% |
| (RA) | Brookfield Real Assets Income Fund Inc. | High Yield | 15.30% | -12.34% | -1.2 | 37% | -14.39% | -5.23% | 27% | 1.61% |
| (FCO) | Aberdeen Global Income Fund, Inc. | Global Income | 14.92% | -9.03% | -2.1 | 42% | -14.24% | -10.42% | 35% | 1.96% |

4. Top 10 best combination of yield and discount
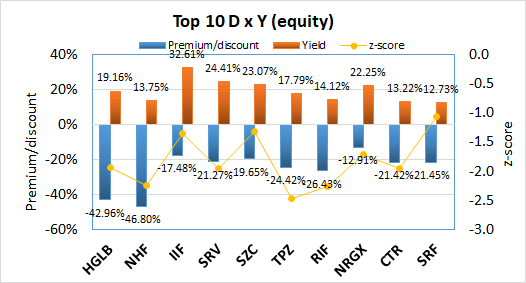
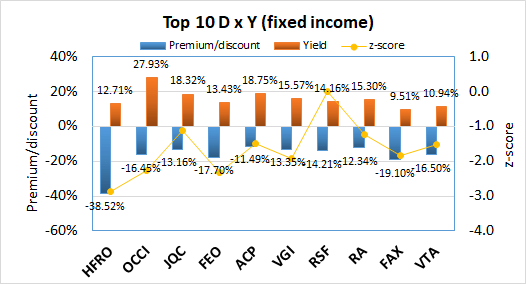
For possible buy candidates, it is probably a good idea to consider both yield and discount. Buying a CEF with both a high yield and discount not only gives you the opportunity to capitalize from discount contraction, but you also get "free" alpha every time the distribution is paid out. This is because paying out a distribution is effectively the same as liquidating the fund at NAV and returning the capital to the unitholders. I considered several ways to rank CEFs by a composite metric of both yield and discount. The simplest would be yield + discount, however I disregarded this because yields and discounts may have different ranges of absolute values and a sum would be biased towards the larger set of values. I finally settled on the multiplicative product, yield x discount. This is because I consider a CEF with 7% yield and 7% discount to be more desirable than a fund with 2% yield and 12% discount, or 12% yield and 2% discount, even though each pair of quantities sum to 14%. Multiplying yield and discount together biases towards funds with both high yield and discount. Since discount is negative and yield is positive, the more negative the "DxY" metric, the better.
Top 10 best DxY equity:
| Ticker | Fund | Category | P/D | Y | Z | Cov | 1Y NAV | D x Y | Dev | Lev | BE |
| (HGLB) | Highland Global Allocation Fund | Global Allocation | -42.96% | 19.16% | -1.9 | 44% | -29.90% | -8.23 | -17.31% | 47% | 0.83% |
| (NHF) | NexPoint Strategic Opportunities Fund | U.S. Allocation | -46.80% | 13.75% | -2.2 | 60% | -25.02% | -6.44 | -25.32% | 30% | 2.03% |
| (IIF) | Morgan Stanley India Investment | Asia Equity | -17.48% | 32.61% | -1.4 | 39% | -25.34% | -5.70 | -3.01% | 0% | 1.28% |
| (SRV) | Cushing® MLP & Infras Total Return | MLPs | -21.27% | 24.41% | -1.9 | 54% | -45.67% | -5.19 | -9.77% | 42% | 2.37% |
| (SZC) | Cushing® NextGen Infrastructure Income | Sector Equity | -19.65% | 23.07% | -1.3 | 17% | -41.52% | -4.53 | -5.78% | 12% | 1.89% |
| (TPZ) | Tortoise Power and Energy Infrastructure | U.S. Allocation | -24.42% | 17.79% | -2.5 | 153% | -40.64% | -4.34 | -13.66% | 42% | 1.76% |
| (RIF) | RMR Real Estate Income Fund | Real Estate | -26.43% | 14.12% | -2.3 | -7% | -28.91% | -3.73 | -6.17% | 41% | 1.67% |
| (NRGX) | PIMCO Energy & Tactical Credit Opps | Global Allocation | -12.91% | 22.25% | -1.7 | 17% | -53.09% | -2.87 | -8.67% | 0% | 2.29% |
| (CTR) | ClearBridge MLP and Midstream TR | MLPs | -21.42% | 13.22% | -2.0 | -8% | -66.75% | -2.83 | -8.56% | 57% | 1.83% |
| (SRF) | Cushing® Energy Income Fund | Sector Equity | -21.45% | 12.73% | -1.1 | -6% | -39.16% | -2.73 | -5.14% | 20% | 5.67% |

Top 10 best DxY fixed income:
| Ticker | Fund | Category | P/D | Y | Z | Cov | 1Y NAV | DxY | Dev | Lev | BE |
| (HFRO) | Highland Floating Rate Opportunities Fd | Senior Loans | -38.52% | 12.71% | -2.9 | 74% | -14.07% | -4.90 | -25.63% | 40% | 1.80% |
| (OCCI) | OFS Credit Company Inc | Senior Loans | -16.45% | 27.93% | -2.3 | 74% | -16.40% | -4.59 | -12.06% | 32% | 7.37% |
| (JQC) | Nuveen Credit Strategies Income Fund | Senior Loans | -13.16% | 18.32% | -1.1 | 38% | -11.43% | -2.41 | -3.61% | 42% | 1.34% |
| (FEO) | First Trust/Aberdeen Emerging Opp | Emerging Market Income | -17.70% | 13.43% | -2.3 | 17% | -9.87% | -2.38 | -6.83% | 8% | 1.73% |
| (ACP) | Aberdeen Income Credit Strategies Fund | Senior Loans | -11.49% | 18.75% | -1.5 | 65% | -26.88% | -2.15 | -6.23% | 39% | 2.28% |
| (VGI) | Virtus Global Multi-Sector Income Fund | Multisector Income | -13.35% | 15.57% | -1.9 | 36% | -6.14% | -2.08 | -7.87% | 31% | 1.76% |
| (RSF) | RiverNorth Marketplace Lending Corp | High Yield | -14.21% | 14.16% | 0.0 | 0% | 0.00% | -2.01 | #VALUE! | 28% | 5.18% |
| (RA) | Brookfield Real Assets Income Fund Inc. | High Yield | -12.34% | 15.30% | -1.2 | 37% | -14.39% | -1.89 | -5.23% | 27% | 0.00% |
| (FAX) | Aberdeen Asia-Pacific Income Fund Inc | Global Income | -19.10% | 9.51% | -1.8 | 55% | -3.93% | -1.82 | -5.15% | 35% | 1.22% |
| (VTA) | Invesco Dynamic Credit Opp | Senior Loans | -16.50% | 10.94% | -1.5 | 96% | -18.07% | -1.81 | -4.53% | 41% | 1.94% |

5. Top 10 best combination of yield, discount and z-score
(May interest buy-and-hold income investors + arbitrage investors)
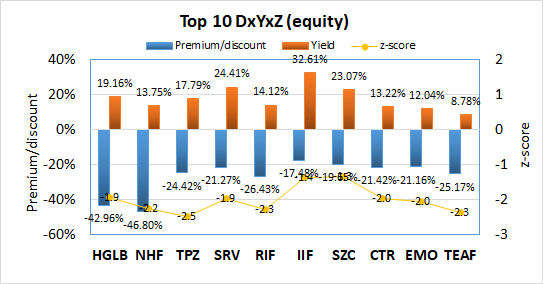
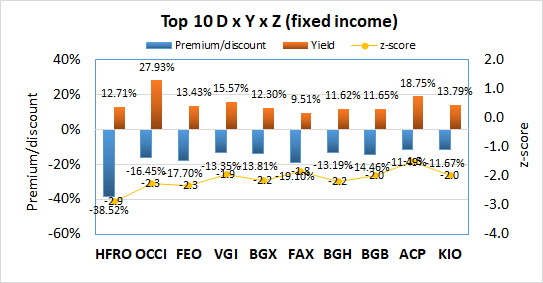
This is my favorite metric because it takes into account all three factors that I always consider when buying or selling CEFs: yield, discount and z-score. The composite metric simply multiplies the three quantities together. A screen is applied to only include CEFs with a negative 1-year z-score. As both discount and z-score are negative while yield is positive, the more positive the "DxYxZ" metric, the better.
Top 10 best DxYxZ equity:
| Ticker | Fund | Category | P/D | Y | Z | Cov | 1Y NAV | D x Y x Z | Dev | Lev | BE |
| (HGLB) | Highland Global Allocation Fund | Global Allocation | -42.96% | 19.16% | -1.9 | 44% | -29.90% | 15.97 | -17.31% | 47% | 0.83% |
| (NHF) | NexPoint Strategic Opportunities Fund | U.S. Allocation | -46.80% | 13.75% | -2.2 | 60% | -25.02% | 14.41 | -25.32% | 30% | 2.03% |
| (TPZ) | Tortoise Power and Energy Infrastructure | U.S. Allocation | -24.42% | 17.79% | -2.5 | 153% | -40.64% | 10.73 | -13.66% | 42% | 1.76% |
| (SRV) | Cushing® MLP & Infras Total Return | MLPs | -21.27% | 24.41% | -1.9 | 54% | -45.67% | 10.12 | -9.77% | 42% | 2.37% |
| (RIF) | RMR Real Estate Income Fund | Real Estate | -26.43% | 14.12% | -2.3 | -7% | -28.91% | 8.47 | -6.17% | 41% | 1.67% |
| (IIF) | Morgan Stanley India Investment | Asia Equity | -17.48% | 32.61% | -1.4 | 39% | -25.34% | 7.75 | -3.01% | 0% | 1.28% |
| (SZC) | Cushing® NextGen Infrastructure Income | Sector Equity | -19.65% | 23.07% | -1.3 | 17% | -41.52% | 5.98 | -5.78% | 12% | 1.89% |
| (CTR) | ClearBridge MLP and Midstream TR | MLPs | -21.42% | 13.22% | -2.0 | -8% | -66.75% | 5.55 | -8.56% | 57% | 1.83% |
| (EMO) | ClearBridge Energy Midstream Opportunity | MLPs | -21.16% | 12.04% | -2.0 | -5% | -69.66% | 5.20 | -8.12% | 61% | 1.87% |
| (TEAF) | Tortoise Essential Assets Income Term | Sector Equity | -25.17% | 8.78% | -2.3 | 27% | -24.08% | 5.19 | -14.66% | 0% | 1.26% |

Top 10 best DxYxZ fixed income:
| Ticker | Fund | Category | P/D | Y | Z | Cov | 1Y NAV | DxYxZ | Dev | Lev | BE |
| (HFRO) | Highland Floating Rate Opportunities Fd | Senior Loans | -38.52% | 12.71% | -2.9 | 74% | -14.07% | 14.10 | -25.63% | 40% | 1.80% |
| (OCCI) | OFS Credit Company Inc | Senior Loans | -16.45% | 27.93% | -2.3 | 74% | -16.40% | 10.43 | -12.06% | 32% | 7.37% |
| (FEO) | First Trust/Aberdeen Emerging Opp | Emerging Market Income | -17.70% | 13.43% | -2.3 | 17% | -9.87% | 5.52 | -6.83% | 8% | 1.73% |
| (VGI) | Virtus Global Multi-Sector Income Fund | Multisector Income | -13.35% | 15.57% | -1.9 | 36% | -6.14% | 4.03 | -7.87% | 31% | 1.76% |
| (BGX) | Blackstone/GSO Long-Short Credit Income | Senior Loans | -13.81% | 12.30% | -2.2 | 109% | -15.37% | 3.69 | -10.89% | 44% | 1.97% |
| (FAX) | Aberdeen Asia-Pacific Income Fund Inc | Global Income | -19.10% | 9.51% | -1.8 | 55% | -3.93% | 3.36 | -5.15% | 35% | 1.22% |
| (BGH) | Barings Global Short Duration High Yield | High Yield | -13.19% | 11.62% | -2.2 | 151% | -29.94% | 3.36 | -8.21% | 37% | 0.00% |
| (BGB) | Blackstone / GSO Strategic Credit Fund | Senior Loans | -14.46% | 11.65% | -2.0 | 108% | -16.42% | 3.33 | -7.08% | 42% | 2.18% |
| (ACP) | Aberdeen Income Credit Strategies Fund | Senior Loans | -11.49% | 18.75% | -1.5 | 65% | -26.88% | 3.25 | -6.23% | 39% | 2.28% |
| (KIO) | KKR Income Opportunities Fund | High Yield | -11.67% | 13.79% | -2.0 | 95% | -20.86% | 3.19 | -7.44% | 29% | 2.04% |

6. Summary statistics
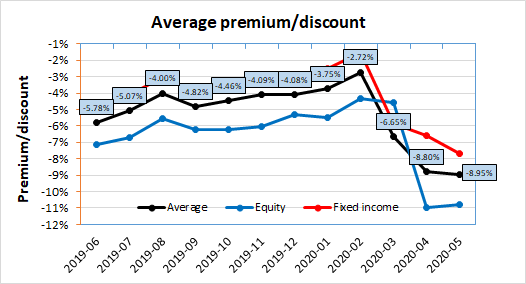
The average premium/discount of all the CEFs in the database is -8.95%, a 105 bps decrease from -8.80% in the previous month. Equity CEF discounts average -10.79%, while fixed income CEF discounts average -7.70%.
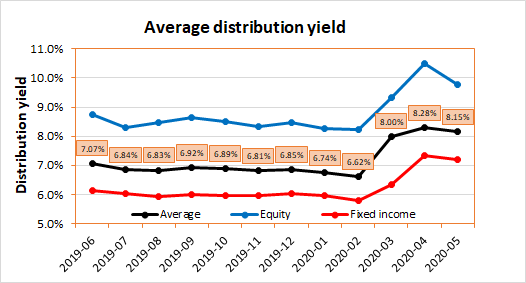
The average distribution yield of all the CEFs in the database is 8.15%, down from 8.28% the month prior. Equity CEFs average 9.95% yield, while fixed income CEFs average 7.19% yield.
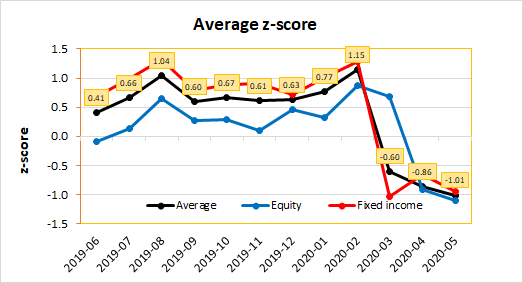
The average 1-year z-score of all the CEFs in the database is -1.01, a decrease from -0.70 a month prior. Equity CEFs have an average z-score of -1.10, while fixed income CEFs have an average z-score of -0.95.
Commentary
Due to the recent market turmoil, we missed two editions of the Chemist's CEF report, my apologies! The majority of our energies was consumed with providing focused guidance during these unprecedented times (e.g. initiating the "Bear Market Thoughts" series), as well as responding to members' private inquiries which as you could imagine, went up several-fold during this crisis. I also considered that our regular metrics such as z-scores, "DxY", "DxYxZ" would not be very useful during times of extreme volatility, when price action was driven strongly by sentiment and liquidity rather than fundamentals.
In our last monthly missive, published three months ago in February, we asked the question: why are discounts so narrow? (see: The Chemist's Closed-End Fund Report, February 2020: Entering Slightly Overpriced Territory and Making Sense Of Narrow Closed-End Fund Discounts) Little did I know how quickly markets would change, and some would say the world with it, only one month later!
I wanted to revisit our thinking going into this bear market by recalling our main findings and recommendations from that report. In summary, even though we did not predict the market crash (and also were a bit too overweight in risky sectors such as CLOs and MLPs, though not because of yield chasing), I believe that our members were well-served by our warnings that the closed-end fund market was getting overvalued, and hence to use a dollar-cost averaging strategy when establishing new positions:
In terms of valuation, I would say that CEFs, as whole, are now in bordering on slightly overvalued territory (up from my "fairly valued" stance for the last several months). Looking at the CEF Alpha chart above shows that, for the most part, CEF discounts have been wider in the past than they are now. This is reflected in the ratings of our portfolios, which show the majority of funds being "hold" rated... Our general advice has been for new members to start researching positions in both "buy" or "hold" rated funds, with a dollar-cost averaging strategy to be especially conservative. Discounts could very well continue to grind higher from here, as rates go down in a benign environment. This is why, despite our cautious stance, we are still fully invested in our portfolios. On the other hand, a serious shock to the markets, like in 2015/2016 or at the end of 2018, could send discounts lower in a hurry. These have a habit of occurring once every few years, so be patient!
Those who were patient and had some dry powder to invest during the March mayhem were well rewarded! We reproduce below some comments from our members who had the nerves to buy when the market crash reached its apex on March 18 (note: subtract 12 hours from my timestamps to get to ET):
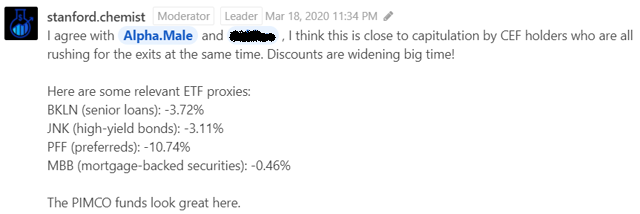





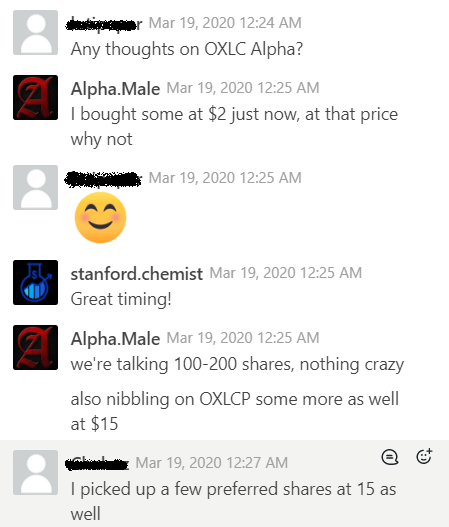


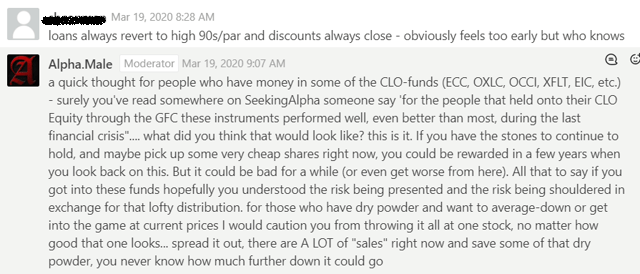

The reason we focus so much on valuations is because we believe that nobody can consistently predict how the market will move in the short-term. Even when the market reached its bottom in March, we could not know at the time whether they would go lower or higher from that point onwards. Yet, having the chance to buy quality assets for 70 cents for an (already discounted) dollar absolutely made sense for the long-term investor. Even if markets had continued to go lower afterwards, I would still have maintained that it would have been a good decision to buy CEFs at a -30% discount. As I wrote to our members before markets opened on March 19, for investors who had decided to stay the course despite the punishing market drop, that discounts were exceedingly attractive for buying:
More conservative investors should still lean towards the safer fixed income funds, such as munis, the PIMCO multisector funds, and investment grade funds such as BTZ. MAV, a high-yield muni fund, has a whopping -26% discount. PFN and PCM closed at -24% and -23% discounts respectively, which is quite incredible for the PIMCO suite. PCI is also a bargain at a -20% discount. More aggressive investors still could include high-yield funds and senior loan funds, as these are non-investment grade. HIO at a -30% discount stands out, as does EHT's -17% discount - remember EHT is a term fund expiring at the end of next year. The riskiest positions are the CLO-containing funds, and even these have a spectrum of riskiness, going from ARDC (least risky) < XFLT < EIC < OCCI/OXLC/ECC (most risky). Among equities, these will be more volatile but some of the discounts on offer are tantalizing. Such as Brookfield Real Assets Income Fund (RA) at a -36% discount, Cohen & Steers REIT and Preferred Income Fund (RNP) at a -31% discount, Eaton Vance Tax-Managed Buy-Write Strategy Fund (EXD) at a -23% discount, Macquarie Global Infrastructure Total Return Fund (MGU) at a -28% discount, and Eaton Vance Tax-Managed Global Buy-Write (ETW) at a -27% discount. There is a huge margin of safety from buying these CEFs vs. the comparable ETFs or open-ended funds right now.
The funds mentioned have all rebounded strongly over the following two months, to varying degrees. For example, the equity CEFs I mentioned have all more than doubled the return of the S&P 500 (SPY) since the March 18 low.
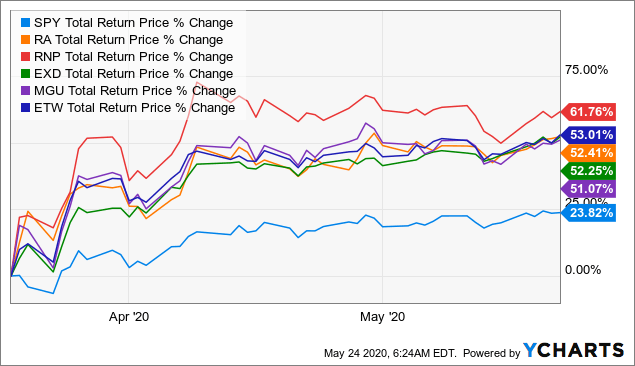
Data by YCharts
Some funds, such as the PIMCO multisector funds, and the CLO funds, have been relative laggards as the securitized credit sectors are still under significant pressure. But like I said above, given that markets cannot be predicted consistently in the short-term, I am still comfortable with recommending and buying those funds on that day. And the fact that no closed-end fund has ever gone bankrupt certainly adds to the comfort and safety aspect of this versus buying single stocks, which may go bust during times of extreme economic stress.
Our overall philosophy can be described as a long-term income-orientated approach (similar to our honorary member Steven Bavaria's "Income Factory" philosophy), with diversification between various sectors and risks, and consideration of premium/discount valuation reversion, being our primary risk-mitigation tools. Admittedly, diversification wasn't so useful during the fastest market crash in recent history that we just experienced, but our focus on valuation helped guide us to be cautious in February when CEF premium/discount valuations rose to 7-year highs, and then to be buyers when markets crashed. Be fearful when others are greedy, and be greedy while others are fearful, as a wise man once said.
Would I have loved to sell our riskier positions in February in advance of the crash? Of course I would have. If I had a crystal ball I would have in fact sold my entire portfolio (as well as my house) and shorted the markets with every last dollar that I had. But who can consistently predict the markets? Yeah, we've all heard by now how Bill Ackman made billions off the stock market plunge, but did you also know that Pershing Square (OTCPK:PSHZF) had severely trailed the S&P 500 for a number of years before 2020?
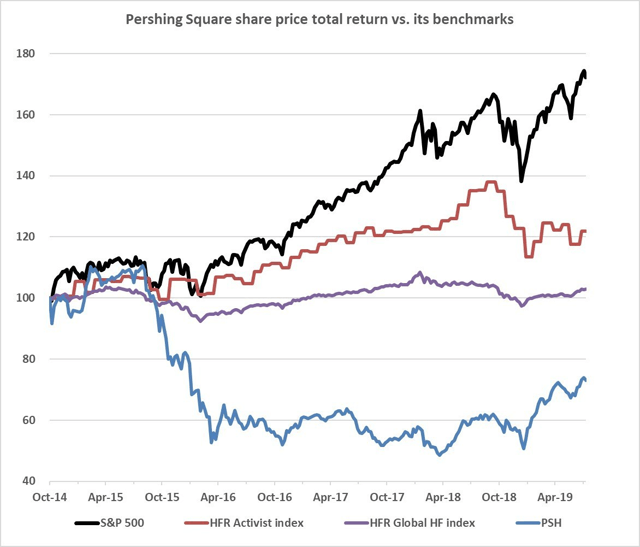
I'm not saying this to disparage Ackman, just to point out the fact that when you have so many experts and billionaires making predictions and bets in the markets every day, a significant fraction of them are going to be "right" whichever way the market moves. The financial media then spotlights on the most successful calls, with that person telling us why they were so sure that this market or stock would behave this way or that. When you read these stories, it might appear so obvious that things would play out the way they predicted, but that is all with the benefit of hindsight. The truth is that no one can predict market movements consistently. Also, you don't hear about experts' bad calls nearly as much, so there is a form of survivorship bias as well.
Am I saying that our "staying the course" approach is the only one? Of course not. Each investor must decide on an investing approach that works for them. Some of our members use technical analysis to help them enter or exit positions. Others selectively pick funds from our portfolio according to their own objectives and views. Still others use stop losses, or hedge with short positions or options, to reduce drawdowns (but there are costs to this).
The most important factors in my opinion to consider when selecting an investing approach are, in my opinion, that (1) the strategy has at least some historical or academic backing, and that (2) it fits well with an investor's individual risk tolerance and temperament. The second point is especially important because it reduces the likelihood of an investor panicking under pressure and making decisions based on emotion, such as selling at lows.
The recent bear market has made some members realize that CEFs are not for them due to the extreme price volatility, and that's okay. In my opinion, premium/discount volatility in CEFs is something to be embraced and exploited rather than feared. And as we've seen with our portfolios, we've experienced virtually no income drop compared to share price declines, and this does help to maintain discipline for "Staying The Course".
So that concludes my thoughts on our investing philosophy for the time being.
Where are we now, and what should an investor do going forward? As both our data as well as the below chart from RiverNorth shows, discounts are now quite a bit wider than their historical average. In fact, in the 6,000 or so market observations since 1996, discounts have only been wider 5% of the time! Remember, wide CEF discounts are a buy signal for the long-term value investor.
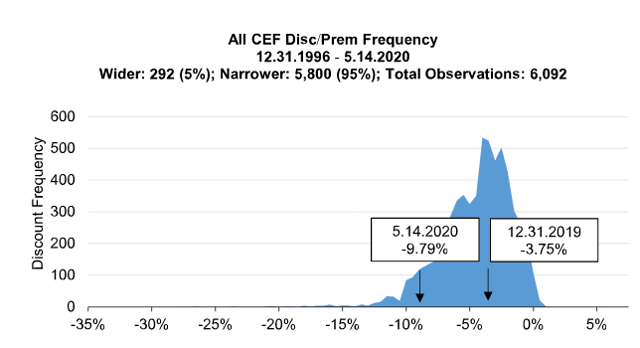
This is why our portfolios have many more "buy" rated funds than at the start of the year, since our ratings are primarily based on premium/discount valuation. Personally, I have been buying discounted CEFs (primarily from our model portfolios) for my own account during the bear market and continuing on today, as income and distributions are gradually received. I have not sold a single share of any of our core positions, except for when following the swap suggestions of our portfolios (which are done after the trade alert is sent out as to not frontrun our members). I put my money where my mouth is! My portfolio has been feeling the pain of market value just like most of our members, but as I mentioned above, the income stream has been much more resilient.
We are due to launch an ETF Income Portfolio for members who may not wish to be exposed to the premium/discount volatility of CEFs. But personally, I would rather be buying CEFs than ETFs right now because of where the average discount lies currently. The converse is also true; when discounts are tight, ETFs would become more appealing relative to CEFs. In hindsight, we should have swapped back to some ETFs in our Tactical Income-100 portfolio when CEF valuations rose to their recent highs; a missed opportunity.
Some members have given feedback saying that they would like regular "flash memos" on what funds to consider buying from the portfolios. I had previously not considered doing this because (1) the portfolios already have BUY/HOLD/SELL ratings, (2) the portfolios were out of cash and so couldn't buy much, and (3) I didn't want to give the impression that I was pumping up stocks that I already own to our members. But I do see the merit of sharing what I personally have been looking at and buying for my own account, if only for idea generation and the laying out of my thought process and nothing else. Therefore, going forward, I will be sharing with our members a "Weekly Flash Memo" on the top picks from our portfolios to buy each week.
Nick has been sharing his purchases in previous posts as well: Closed-End Funds: More Purchases I Made Through April.
Interested in knowing our weekly top picks from our ~8%-yielding portfolios?
At the CEF/ETF Income Laboratory, we manage market-beating closed-end fund (CEF) and exchange-traded fund (ETF) portfolios targeting safe and reliable ~8% yields to make income investing easy for you. Check out what our members have to say about our service.

To see all that our exclusive membership has to offer, sign up for a free trial by clicking on the button below!

Disclosure: I am/we are long ARDC, ECC, ECCB, ECCX, ECCY, EIC, ETW, FPL, MAV, OCCI, OCCIP, OXLC, OXLCM, OXLCO, OXLCP, PCI, PCM, RA, RNP, XFLT. I wrote this article myself, and it expresses my own opinions. I am not receiving compensation for it (other than from Seeking Alpha). I have no business relationship with any company whose stock is mentioned in this article.