GBP/JPY Price Analysis: Pound under pressure below the 131.50 level vs. yen
by Flavio Tosti- GBP/JPY remains weak below the 131.46 resistance level.
- The level to beat for sellers is the 130.80 support.
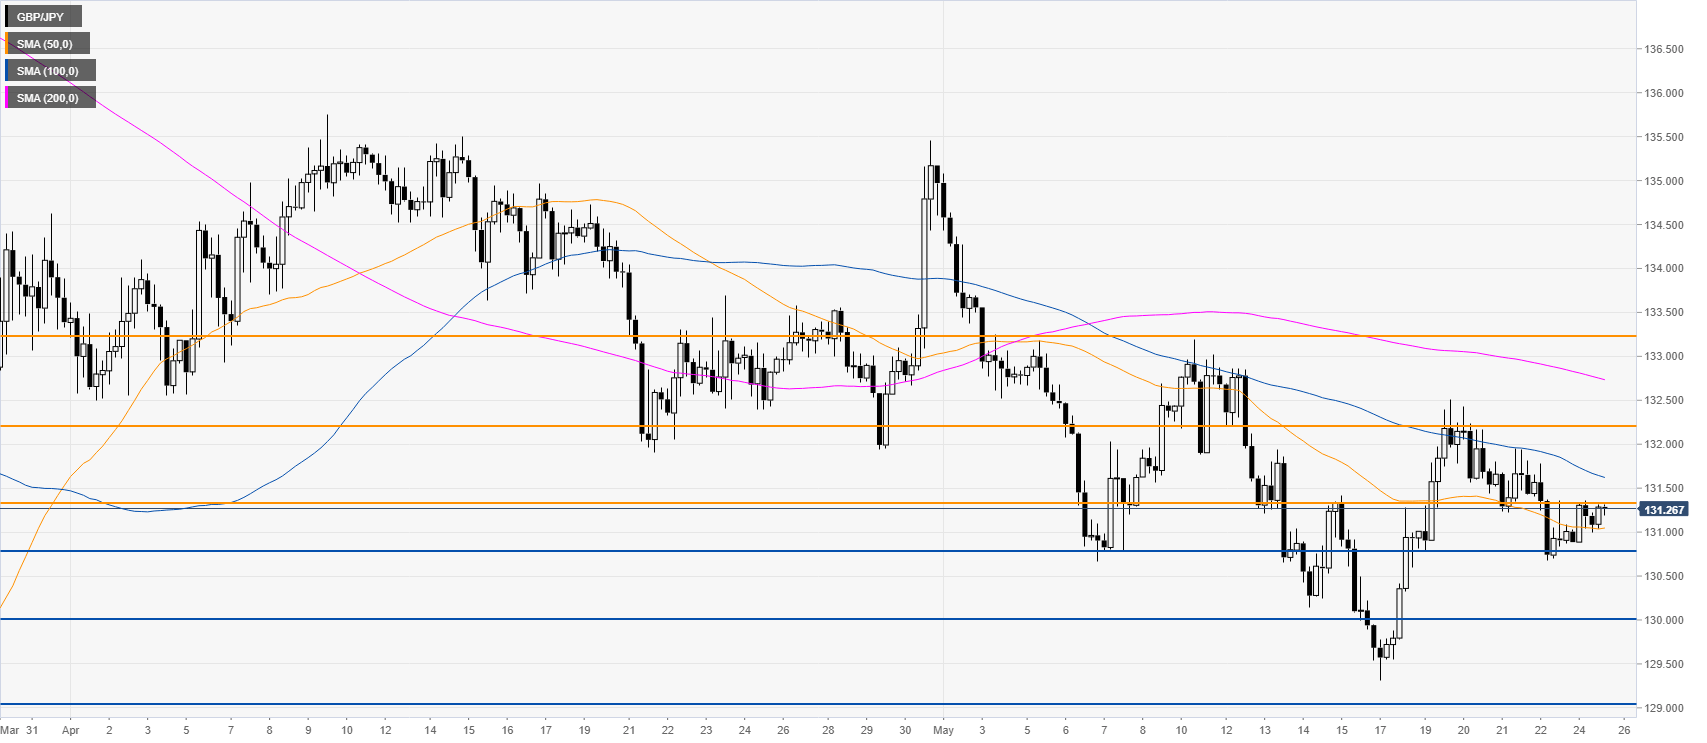
GBP/JPY four-hour chart
GBP/JPY is trading below the 100 and 200 SMA on the four-hour chart while making lower lows and lower highs which is the hallmark of a bear trend. The currency cross remains weak below the 131.46 resistance just above the 50 SMA. Sellers should remain in charge with a potential drop towards the 130.80, 130.00 and 129.00 levels. On the flip side, resistances are seen near 131.46, 132.29 and 133.25 price levels.

Resistance: 131.46, 132.29, 133.25
Support: 130.80, 130.00, 129.00
Additional key levels
GBP/JPY
| Overview | |
|---|---|
| Today last price | 131.35 |
| Today Daily Change | 0.46 |
| Today Daily Change % | 0.35 |
| Today daily open | 130.89 |
| Trends | |
|---|---|
| Daily SMA20 | 132.03 |
| Daily SMA50 | 132.4 |
| Daily SMA100 | 136.88 |
| Daily SMA200 | 137.21 |
| Levels | |
|---|---|
| Previous Daily High | 131.78 |
| Previous Daily Low | 130.68 |
| Previous Weekly High | 132.51 |
| Previous Weekly Low | 129.32 |
| Previous Monthly High | 135.75 |
| Previous Monthly Low | 131.91 |
| Daily Fibonacci 38.2% | 131.1 |
| Daily Fibonacci 61.8% | 131.36 |
| Daily Pivot Point S1 | 130.45 |
| Daily Pivot Point S2 | 130.01 |
| Daily Pivot Point S3 | 129.34 |
| Daily Pivot Point R1 | 131.55 |
| Daily Pivot Point R2 | 132.22 |
| Daily Pivot Point R3 | 132.66 |