Gold Price News and Forecast: XAU/USD - Great Recession vs. 2020 coronavirus crisis
by FXStreet TeamGold daily news: XAU/USD trading along last week’s lows
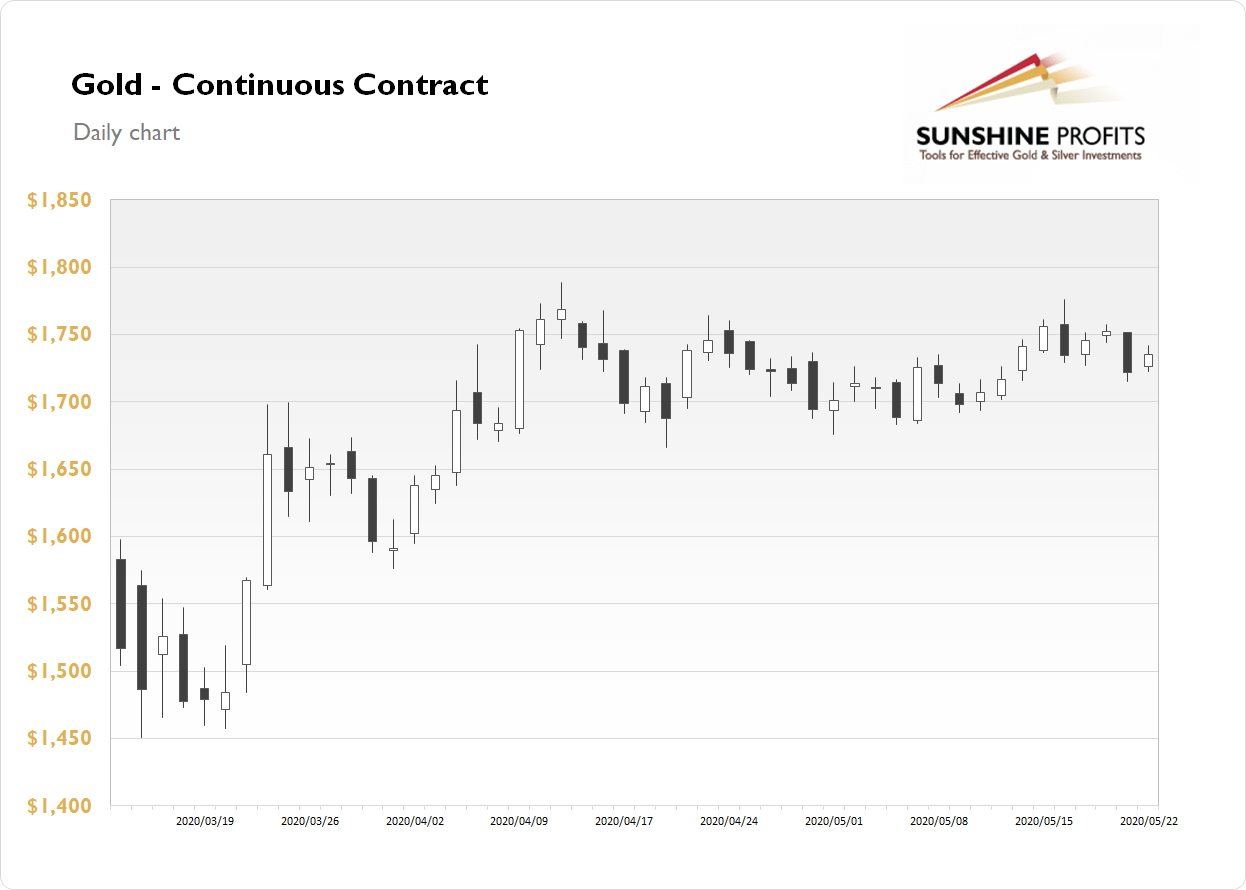
The gold futures contract gained 0.79% on Friday as it slightly retraced Thursday decline of 1.7%. On Thursday it extended a downward correction from the last Monday's new monthly high of $1,775.80. The market has retraced almost all of the decline from April 14 high of $1,788.80, before reversing downwards again. Gold price continues to trade within an over month-long consolidation, as we can see on the daily chart. Read more...

Implications for Gold – 2007-9 Great Recession vs. 2020 coronavirus crisis
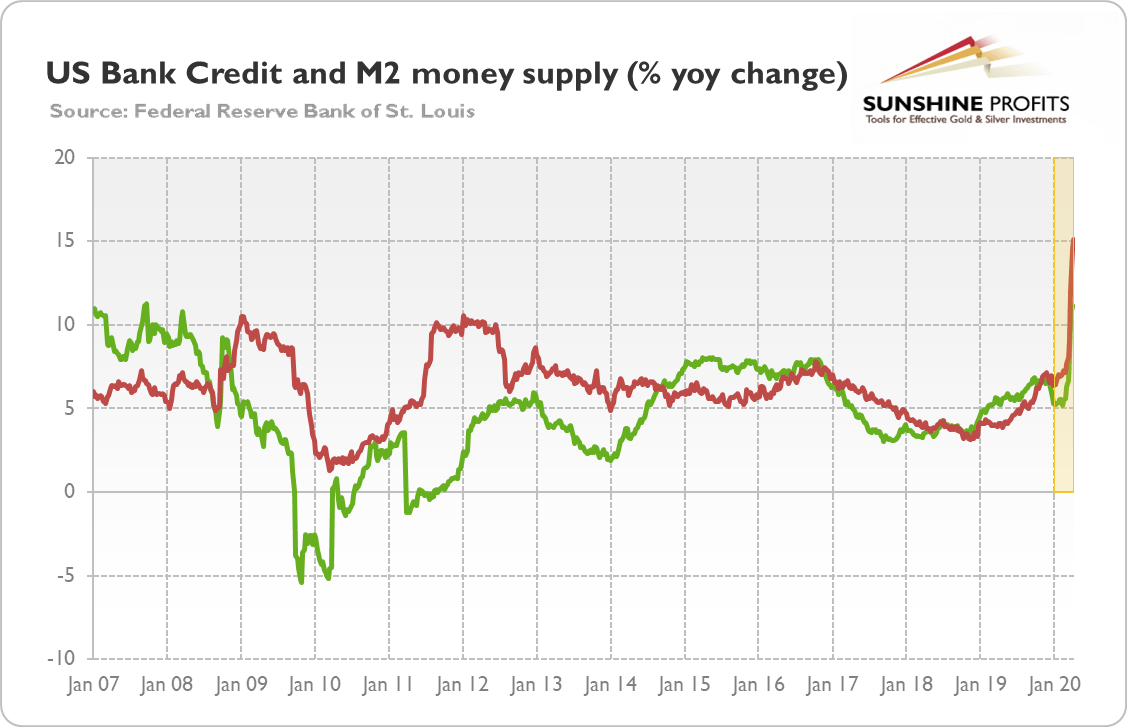
When the economic crisis hits, the first instinct is to analyze the previous catastrophes to learn what to expect from and how to handle the current calamity. So, not surprisingly, many analysts have already pointed to the 2008 global financial crisis (GFC) as the most relevant example. However, is really the current coronavirus recession similar to the Great Recession? Let's compare these two big crises and draw investment conclusions for the gold market!
First of all, in terms of scale and pace of the decline, the current crisis is much broader and deeper. It hits practically the whole globe, not only advanced countries, and it affects all offline sectors, not just the financial sector and construction. And in just four weeks, 22 million of Americans made claims for the unemployment benefit.

Gold Price Analysis: Trades with modest losses, downside seems limited
Gold traded with a mild negative bias through the mid-European session amid the prevalent risk-on mood, albeit has managed to defend the $1722 horizontal support.
Looking at the broader picture, the recent move up has been along a two-month-old upward sloping channel. This coupled with the fact that technical indicators on the daily chart are holding in the bullish territory supports prospects for a further near-term appreciating move.
However, oscillators on hourly charts have been struggling to gain any meaningful traction. The set-up – though seems tilted in favour of bullish traders – warrants some caution before positioning aggressively for any meaningful appreciating move amid stronger USD.
XAU/USD
| Overview | |
|---|---|
| Today last price | 1726.74 |
| Today Daily Change | -7.48 |
| Today Daily Change % | -0.43 |
| Today daily open | 1734.22 |
| Trends | |
|---|---|
| Daily SMA20 | 1715.66 |
| Daily SMA50 | 1663.44 |
| Daily SMA100 | 1626.42 |
| Daily SMA200 | 1559.69 |
| Levels | |
|---|---|
| Previous Daily High | 1740.43 |
| Previous Daily Low | 1724.46 |
| Previous Weekly High | 1765.38 |
| Previous Weekly Low | 1717.34 |
| Previous Monthly High | 1747.82 |
| Previous Monthly Low | 1568.46 |
| Daily Fibonacci 38.2% | 1734.33 |
| Daily Fibonacci 61.8% | 1730.56 |
| Daily Pivot Point S1 | 1725.64 |
| Daily Pivot Point S2 | 1717.07 |
| Daily Pivot Point S3 | 1709.67 |
| Daily Pivot Point R1 | 1741.61 |
| Daily Pivot Point R2 | 1749.01 |
| Daily Pivot Point R3 | 1757.58 |