CEFs Vs. The Gone Fishin' Portfolio
by Faithful Steward InvestingSummary
- Sometimes, it's good to put our portfolio strategy to a series of tests to confirm our investing thesis or reveal if a change is warranted.
- CEFs can be volatile, as the coronavirus crisis made very clear.
- Let's see how a CEF portfolio would have fared against a more traditional approach.
For several years now, I've been invested in closed-end funds for income. After a positive - although harrowing - experience with my first CEF through the 2008 crisis, I eventually created a perpetual income portfolio using mostly CEFs. I call it my Personal Perpetuity Portfolio or PPP.
The recent coronavirus crisis did a job on our PPP. This wasn't at all unexpected, knowing how volatile CEFs can be during rough patches. I decided to put my investment philosophy through a test because, after all, not only is our future riding on it but also my elderly mother, for whom I manage a portion of her investments. I wanted to be crystal clear that I am on the right track, so I spent several days conducting a series of backtests and comparisons. I'd like to share with you what I learned.
The Traditional Approach
First, I needed a good yardstick against which to measure my CEF strategy: a simplified portfolio with a more traditional approach would be just the ticket. The Gone Fishin' Portfolio created by Alexander Green (The Oxford Club, Investment U) immediately came to mind. I had read Green's book (The Gone Fishin' Portfolio) when it first came out in 2008 and was impressed by the philosophy and the simplicity behind it. It holds 10 Vanguard funds that provide a diversified mix of assets and has earned steady returns, beating the S&P since its inception in 2003. The GFP is easy to implement and manage, requiring only rebalancing once a year. I grabbed my copy of the book and set to work on my backtests and comparisons.
Limitations of the Backtest
Using Portfolio Visualizer's Backtest Tool makes these comparisons pretty easy. You can compare two or three portfolios within specific scenarios. I wanted to see how the two portfolios in question would have compounded over a number of years and also how monthly withdrawals would have affected their sustainability.
A problem I encountered right away was that, using the free version of the tool, I could only enter a total of 25 ticker symbols between the two portfolios. With the GFP holding 10 mutual funds, that left only 15 holdings for my personal perpetuity portfolio. Since my PPP typically holds 25-30 funds, that meant a lot of whittling down.
The second drawback of the backtest tool is that it will only date back as far as the youngest fund entered. This meant that I had to keep switching out funds in the test until I could get it to measure back far enough to offer some meaningful data. I tried to stay true to the diversity of the original model.
After quite a bit of juggling, I finally landed on using 9 of the GFP funds and 16 PPP funds (14 CEFs, 1 REIT, and 1 BDC). It wasn't a perfect comparison, but I think it captured the spirit of the intended exercise. With these 25 funds, I was able to backtest to January 2007, incorporating the effects of the Financial Crisis. This was important to include because shorter tests only covered the long bull market, producing a less accurate picture.
The third drawback of the backtest tool is that, while it can account for monthly, quarterly, or yearly withdrawals of a set amount or percentage, it doesn't account for increasing the size of withdrawals to accommodate inflation or the need for increased income later in the period. However, it still gives a comparison of portfolios and how the same withdrawals affect each one.
I set up both portfolios to be rebalanced once a year. Because of this, rebalancing and reinvesting at opportune times, as the PPP strategy would entail, does not factor into the comparison, somewhat skewing real-life results and creating a fourth drawback to the test.
The Comparisons
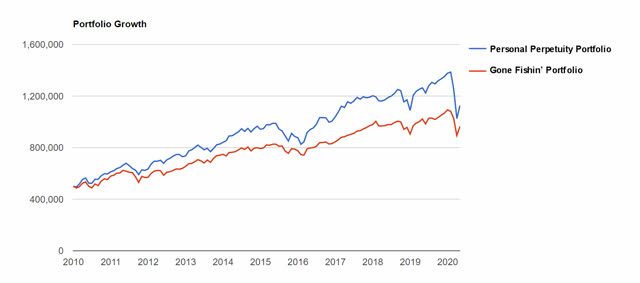
I initially did my comparison over the past 10 years. Here's how $500,000 would have grown in each portfolio during the recent bull market:

To be honest, I was surprised to see that Green's GFP didn't keep up as well. Looking into it further, I discovered that its exposure to international equities had caused it to lag during this particular time frame (Green expects this to turn around). The inclusion of its gold fund had also put a drag on the portfolio, so I left it out of the lineup in this exercise to give the GFP more of a fair shake as an indicator of the long-term picture.
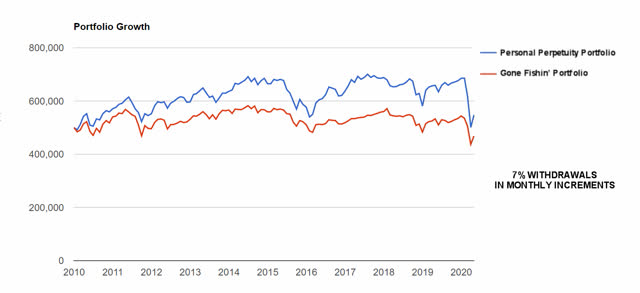
Then, I compared what it would look like to withdraw 7% a year, taken in monthly increments:

According to this data chart, the PPP stayed strong while the GFP did fairly well, although it showed some signs of weakness the last few years.
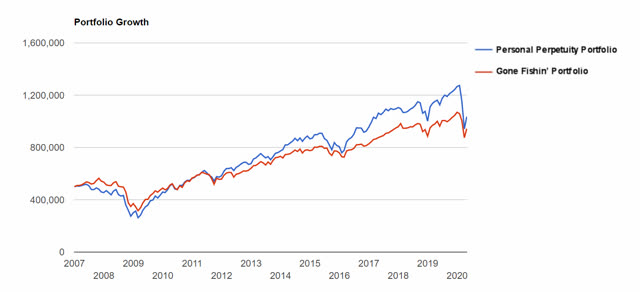
Knowing how volatile my PPP can be against a more conservative model such as the GFP - especially during the turmoil in the markets - to draw a more fair comparison, I then charted the data going back to January 2007 so that it would include the collapse in 2008. Here's the growth chart of both portfolios:

Going back to 2007 reveals how the GFP is steadier in its upward climb, while the PPP has deeper drawdowns and bigger recoveries. Despite its accentuated movements - or perhaps because of them - the PPP pulled out ahead of the Gone Fishin' Portfolio within the first five years.
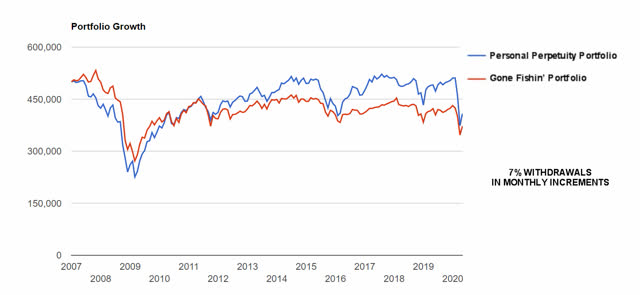
Now, let's look at how they fared while withdrawing 7% per year in monthly increments:

Both portfolios took a serious hit the first two years but recovered despite monthly withdrawals. (Note: these monthly draws were .58% of each portfolio's value.) The GFP never fully regained its original value yet stayed within a fairly tight range and would have continued to do so had COVID-19 not interfered in early 2020. The PPP, on the other hand, did regain its original value but wasn't able to break above it despite its exaggerated movements. I expect the next recovery to be as notable as the previous events.
Conclusions About This Comparison
The Gone Fishin' Portfolio is a tried-and-true portfolio model that has stacked up well against the S&P long term. Its philosophy is straightforward: invest simply in a diversified portfolio that you don't have to spend your precious time on. Its strength is that it is basically worry-free: you can expect market-beating returns by owning only 10 funds and rebalancing just once a year. It is neither too conservative nor too aggressive. With this low maintenance approach, it can free up your time to do what you enjoy instead.
The drawbacks of the GFP are that: 1) it doesn't compound as well as a CEF portfolio, 2) it provides less income (drawn as a percentage of the balance), and 3) you have to sell shares every month in order to draw income.
My Personal Perpetuity Portfolio is based on the philosophy that an investor can draw income without having to sell any shares, thus creating a perpetual income stream that may last indefinitely. It typically holds 25-30 CEFs or similar securities to diversify the portfolio and help reduce risk. Not having to sell shares to meet income needs does two things: it leaves the underlying portfolio intact and the distributions produce actual cash in my account available for immediate withdrawal. Automating monthly withdrawals is a snap.
The drawbacks of the PPP are that: 1) it requires a more hands-on approach (reinvesting and rebalancing at opportune times or occasionally switching funds), 2) it produces much wider swings in market value, and 3) the investor must mitigate the effects of distribution cuts and rights offerings that may occur along the way.
In all, as always, it boils down to personal investing goals. For some, a simpler, hands-off approach is worth the lower return. For me, however, I was looking for confirmation that my investing approach can stand up against a tried-and-true investing model. I believe I got my answer.
Disclosure: I/we have no positions in any stocks mentioned, and no plans to initiate any positions within the next 72 hours. I wrote this article myself, and it expresses my own opinions. I am not receiving compensation for it (other than from Seeking Alpha). I have no business relationship with any company whose stock is mentioned in this article.
Additional disclosure: I am not an investment professional. Please do your own due diligence before embarking on any investment strategy.