Natural Gas Bounce - As Expected
by Andrew HechtSummary
- A higher low in the energy commodity.
- The signs of falling production continue.
- Trading from the long side in natural gas.
- Why UGAZ is a far better instrument than UNG, but only appropriate for short-term positions.
- Action junkies love the natural gas market.
On Monday, May 18, Seeking Alpha published my last article on natural gas that I had written on May 15. On that day, June natural gas futures settled at below the $1.65 per MMBtu level after trading to a low of $1.595 on Wednesday, May 15. I suggested that at below the $1.70 level, natural gas was back in the buy zone.
Last week, natural gas never traded below the $1.702 level, as the price took off on the upside at on Monday,
One of my favorite comments in last week’s piece summed up the natural gas market in five simple words. JDOW4 called natural gas, “The crack cocaine of commodities.”
Crack cocaine is a highly addictive drug. Meanwhile, the Velocity Shares 3X Long Natural Gas ETN product (UGAZ) is the crack pipe of choice for the natural gas addicts looking for another dose of action each day. As I wrote last week’s piece, the editor who looks after my work here at Seeking Alpha noted that the core unlevered ETF for natural gas market was the United States Natural Gas Fund (UNG). If he were a gas addict, he would have known that UGAZ is the drug of choice for those hooked on volatility and action.
A higher low in the energy commodity
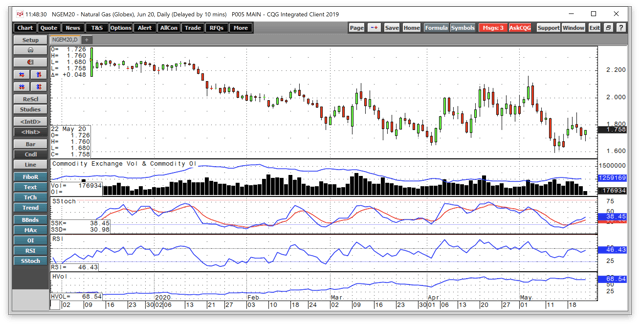
Natural gas rallied from the higher low at $1.595 on May 13.

Source: CQG
The daily chart highlights that the price rose to a high of $1.889 per MMBtu on May 20, where it ran out of upside steam at a lower high. The price fell to a low of $1.68 last Friday as price momentum, and relative strength indicators were below neutral conditions. Natural gas quickly recovered before the weekend. The open interest metric at 1.259 million contracts on May 21, was a bit lower than the same time last year when it stood at 1.306 million. The lower price and the environment caused by the global pandemic are likely responsible for the lower level of the total number of open long and short positions in the natural gas futures market. Daily historical volatility at over 68% remained closer to the highs than the lows in 2020 as daily trading ranges remain wide.
The price dropped on Thursday and Friday, despite a lower inventory injection than in past weeks. By the end of Friday’s session, natural gas was back around the $1.75 per MMBtu level.
The signs of falling production continue
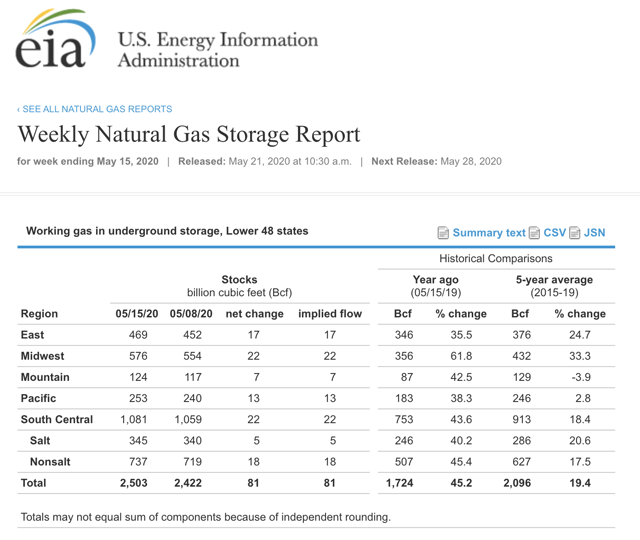
According to Estimize, a crowdsourcing website, the consensus estimates for the injection into storage in natural gas as of the week ending May 15 were between 96-99 billion cubic feet.

Source: EIA
The chart shows that the data shows an inventory build of 81 bcf, which was not bearish. Total stockpiles stood at 2.503 trillion cubic feet as of May 15, 45.2% above last year’s level, and 19.4% over the five-year average for the middle of May.
In another supportive sign for the natural gas market when it comes to falling output, the percentage over last year’s stockpile level fell for the ninth consecutive week. However, natural gas shrugged off the data, and the price headed lower in the aftermath of the inventory numbers.

Source: CQG
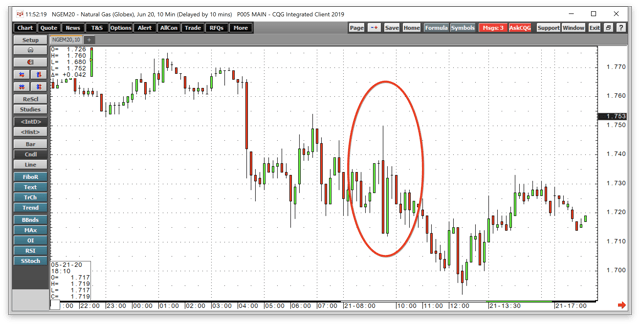
The ten-minute chart illustrates the decline in the wake of the latest EIA data that took the price just below the $1.70 level on May 21 and 22. After trading to almost $1.90 on May 20, the price fell by 20 cents per MMBtu. Natural gas was trading at the $1.75 level on May 22, after recovering from the low of the session.
Despite the evidence of falling production, the price of natural gas was under pressure after the release of the EIA data.
Trading from the long side in natural gas
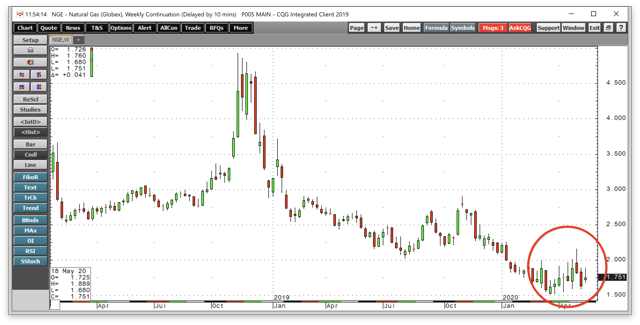
Natural gas was back in the buy zone with the price at the $1.70 per MMBtu level. The price action on the weekly chart displays a pattern of marginally higher lows since late March.

Source: CQG
The weekly chart shows that natural gas fell to its lowest level since 1995 in late March when the price traded at $1.519 per MMBtu during the week of March 23. The next week, the low was $1.521. The next higher low came in mid-April at $1.555, and during the week of April 27, it fell to a bottom of $1.593. The May 13 low at $1.595 was a continuation of the pattern of higher lows in the natural gas futures market.
I view the $1.60 to $1.70 level as the buy-zone in natural gas for short-term trades. The stop would be below the $1.595 per MMBtu level, which negates the pattern of higher lows.
Why UGAZ is a far better instrument than UNG
I believe the Velocity Shares 3X Long Natural Gas ETN product (UGAZ) is a far more attractive and ubiquitous product for natural gas trading than the United States Natural Gas Fund. UGAZ and UNG both have significant net assets of $439.3 million and $433.85 million, respectively. UGAZ trades an average of over 7.8 million shares each day, while UNG’s average volume is 4.65 million. UGAZ charges a 1.65% expense ratio, while the cost of trading UNG is 1.33%.
UGAZ is only appropriate for short-term trades because the triple leverage causes significant time decay as well as contango or the forward premium in the natural gas market if the price remains stable or moves lower. UNG is an unleveraged product, so time decay is limited to contango costs.
Most market participants that venture into the natural gas are looking for immediate gratification rather than a medium to long-term trade or investment position. The cost of contango makes an investment in natural gas prohibitive. The spread between June 2020 and January 2021 natural gas futures was at $1.225 or over 71.6% as of the close of business on May 21. While both UNG and UGAZ trade millions of shares each day, UGAZ trades more. Finally, daily volatility at over 67% and weekly price variance at over 55% makes natural gas a trading rather than an investment sardine.
Action junkies love the natural gas market
The casinos in Vegas remain closed. There are still no sports to bet on these days. Meanwhile, those looking for action in the futures market seem to gravitate to the natural gas arena. Last week, the energy commodity traded in a 20.9 cents range, the week before, the trading back was 35.1 cents. The wide ranges on a commodity that has a nominal price of under $2 create lots of trading opportunities.
Investing in the natural gas market is more than a challenge. Even if a bull believes that lower production will lead to higher prices during the peak season in 2020/2021, the price would have to rally by $1.225 between now and January 2021 to break even given the current level of contango.
The natural gas futures market is a magnet for action junkies. The bullish UGAZ and bearish DGAZ products are crack pipes for the addicted. The triple leveraged instruments force market participants to make quick decisions when it comes to entry and exit points for risk positions. UNG can lull market participants into a false sense of security, as contango eats their lunch over time. I believe natural gas was in the buy zone at around the $1.70 level. Below $1.595 I would be out of any long position and would take another look once the dust settled. At the $1.85 level, I would look to take profits as the odds of another lower high appears high. Bulls can make money, bears can profit, but pigs tend to go to the slaughterhouse. UGAZ and DGAZ require a dynamic approach. UNG is an investment vehicle that could lead overconfident bulls to wind up as bacon on the plates of natural gas crack addicts.
The Hecht Commodity Report is one of the most comprehensive commodities reports available today from the #2 ranked author in both commodities and precious metals. My weekly report covers the market movements of 20 different commodities and provides bullish, bearish and neutral calls; directional trading recommendations, and actionable ideas for traders. I just reworked the report to make it very actionable!
Disclosure: I/we have no positions in any stocks mentioned, and no plans to initiate any positions within the next 72 hours. I wrote this article myself, and it expresses my own opinions. I am not receiving compensation for it (other than from Seeking Alpha). I have no business relationship with any company whose stock is mentioned in this article.
Additional disclosure: The author always has positions in commodities markets in futures, options, ETF/ETN products, and commodity equities. These long and short positions tend to change on an intraday basis.