USD/INR New York Price Forecast: Greenback knocking at the 76.00 resistance vs. Indian rupee
by Flavio Tosti- USD/INR is challenging the 76.00 resistance as the New York forex session is starting.
- A daily close above the 76.00 level can be seen as bullish.
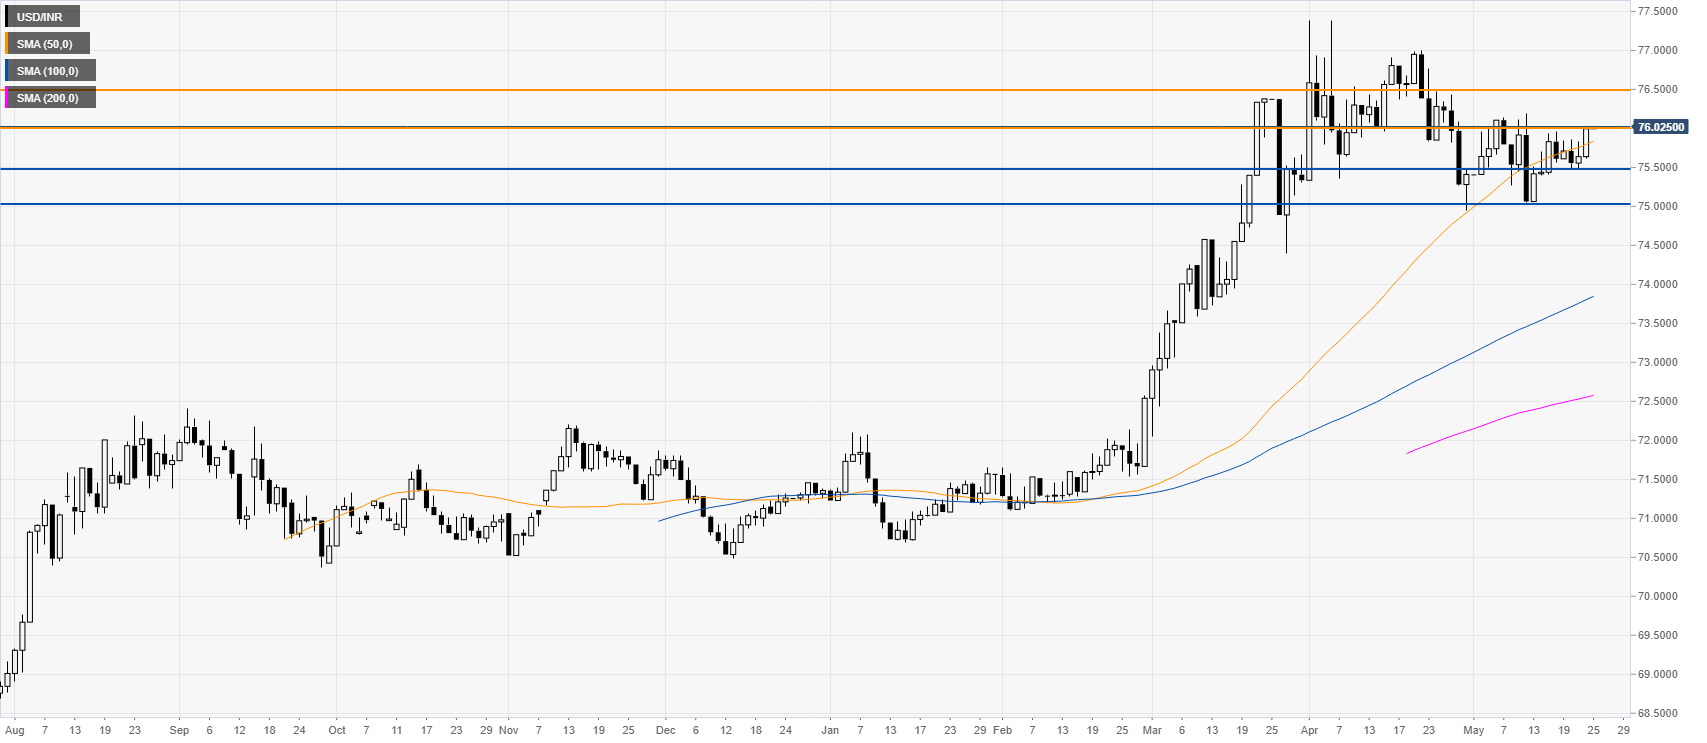
USD/INR daily chart
USD/INR is testing the 76.00 figure while above the main SMAs on the daily chart. The bulls remain in charge at the start of the new trading week. A close above the 76.00 resistance on a daily closing basis should lead to more upside potential with 76.50 as a possible target. On the other hand, a break below the 75.50 support can lead to more down in the medium-term.

Additional key levels
USD/INR
| Overview | |
|---|---|
| Today last price | 76.025 |
| Today Daily Change | 0.0299 |
| Today Daily Change % | 0.04 |
| Today daily open | 75.9951 |
| Trends | |
|---|---|
| Daily SMA20 | 75.6864 |
| Daily SMA50 | 75.7852 |
| Daily SMA100 | 73.8282 |
| Daily SMA200 | 72.5673 |
| Levels | |
|---|---|
| Previous Daily High | 76.0223 |
| Previous Daily Low | 75.62 |
| Previous Weekly High | 76.0223 |
| Previous Weekly Low | 75.4707 |
| Previous Monthly High | 76.975 |
| Previous Monthly Low | 75.14 |
| Daily Fibonacci 38.2% | 75.8686 |
| Daily Fibonacci 61.8% | 75.7737 |
| Daily Pivot Point S1 | 75.736 |
| Daily Pivot Point S2 | 75.4768 |
| Daily Pivot Point S3 | 75.3337 |
| Daily Pivot Point R1 | 76.1383 |
| Daily Pivot Point R2 | 76.2814 |
| Daily Pivot Point R3 | 76.5406 |