US Dollar Index Price Analysis: Upside targets the 100.00 mark
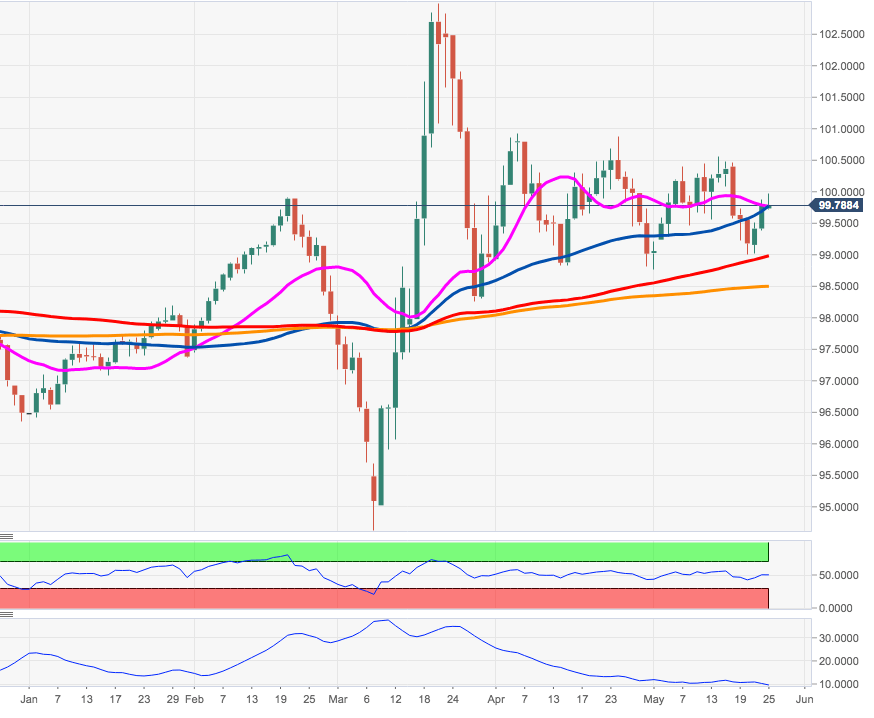
by Pablo Piovano- DXY has so far run out of steam just below the 100.00 yardstick.
- Above 100.00 the next hurdle aligns at the 100.50 region.
Monday’s upside momentum in DXY appears to have lost some vigour in the vicinity of the key barrier at 100.00 the figure so far.
A surpass of the 100.00 barrier should put the key resistance in the 100.50 region back on traders’ radar. In this resistance area coincide a Fibo retracement of the 2017-2018 drops and monthly peaks.
While above the key 200-day SMA, today at 98.48, the constructive stance is expected to remain unchanged.
DXY daly chart

Dollar Index Spot
| Overview | |
|---|---|
| Today last price | 99.81 |
| Today Daily Change | 26 |
| Today Daily Change % | 0.01 |
| Today daily open | 99.8 |
| Trends | |
|---|---|
| Daily SMA20 | 99.77 |
| Daily SMA50 | 99.98 |
| Daily SMA100 | 98.95 |
| Daily SMA200 | 98.49 |
| Levels | |
|---|---|
| Previous Daily High | 99.88 |
| Previous Daily Low | 99.39 |
| Previous Weekly High | 100.47 |
| Previous Weekly Low | 99 |
| Previous Monthly High | 100.93 |
| Previous Monthly Low | 98.81 |
| Daily Fibonacci 38.2% | 99.69 |
| Daily Fibonacci 61.8% | 99.57 |
| Daily Pivot Point S1 | 99.5 |
| Daily Pivot Point S2 | 99.2 |
| Daily Pivot Point S3 | 99 |
| Daily Pivot Point R1 | 99.99 |
| Daily Pivot Point R2 | 100.18 |
| Daily Pivot Point R3 | 100.48 |