USD/INR Price News: Indian rupee bears cheer break of monthly support line, 76.25 in focus
by Anil Panchal- USD/INR takes the bids after breaking monthly resistance line.
- A descending trend line from April 06 on bulls’ radar for now.
- 21-day SMA adds strength to the resistance-turned-support.
- MACD teases bulls for the first time in seven weeks.
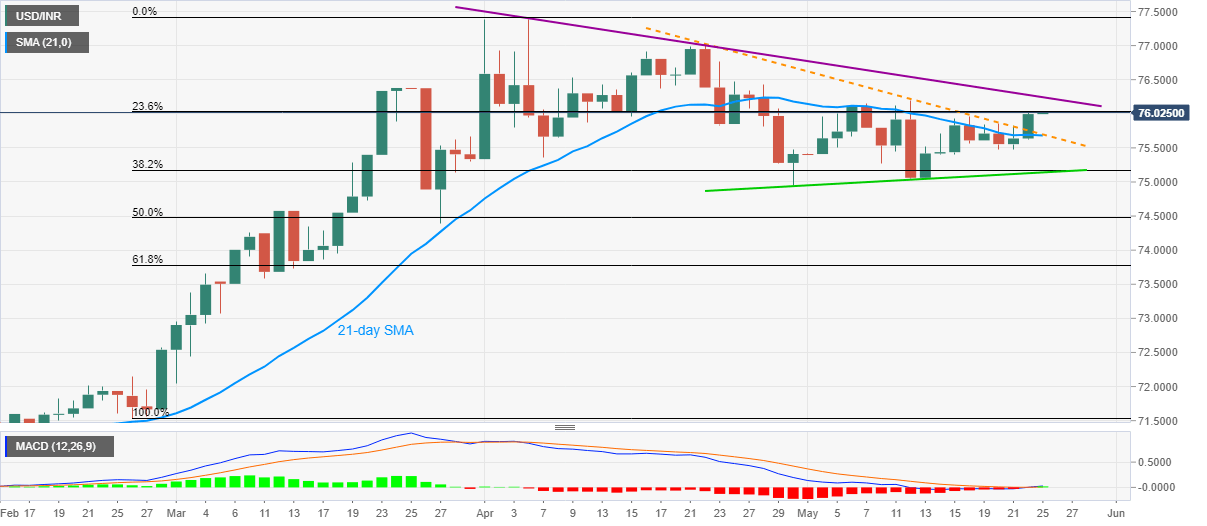
While extending its break of the monthly resistance line, now support, USD/INR stays positive around 76.03 amid the initial Indian session on Monday.
Considering the sustained trading above short-term key resistance as well as bullish MACD, the pair is likely extending the recovery moves towards another falling trend line from April 06, at 76.25.
Though, a successful break of 76.25 will fuel the bids toward 77.00 ahead of pushing the bulls to challenge April month top near 77.40.
Meanwhile, 21-day SMA joins the resistance-turned-support line, near 75.70/65, to strengthen the immediate support.
Should there be a daily closing below 75.65, the monthly support line around 75.15/10 could grab the bears’ attention.
USD/INR daily chart

Trend: Bullish
Additional important levels
| Overview | |
|---|---|
| Today last price | 76.025 |
| Today Daily Change | 0.0299 |
| Today Daily Change % | 0.04% |
| Today daily open | 75.9951 |
| Trends | |
|---|---|
| Daily SMA20 | 75.6864 |
| Daily SMA50 | 75.7852 |
| Daily SMA100 | 73.8282 |
| Daily SMA200 | 72.5673 |
| Levels | |
|---|---|
| Previous Daily High | 76.0223 |
| Previous Daily Low | 75.62 |
| Previous Weekly High | 76.0223 |
| Previous Weekly Low | 75.4707 |
| Previous Monthly High | 76.975 |
| Previous Monthly Low | 75.14 |
| Daily Fibonacci 38.2% | 75.8686 |
| Daily Fibonacci 61.8% | 75.7737 |
| Daily Pivot Point S1 | 75.736 |
| Daily Pivot Point S2 | 75.4768 |
| Daily Pivot Point S3 | 75.3337 |
| Daily Pivot Point R1 | 76.1383 |
| Daily Pivot Point R2 | 76.2814 |
| Daily Pivot Point R3 | 76.5406 |