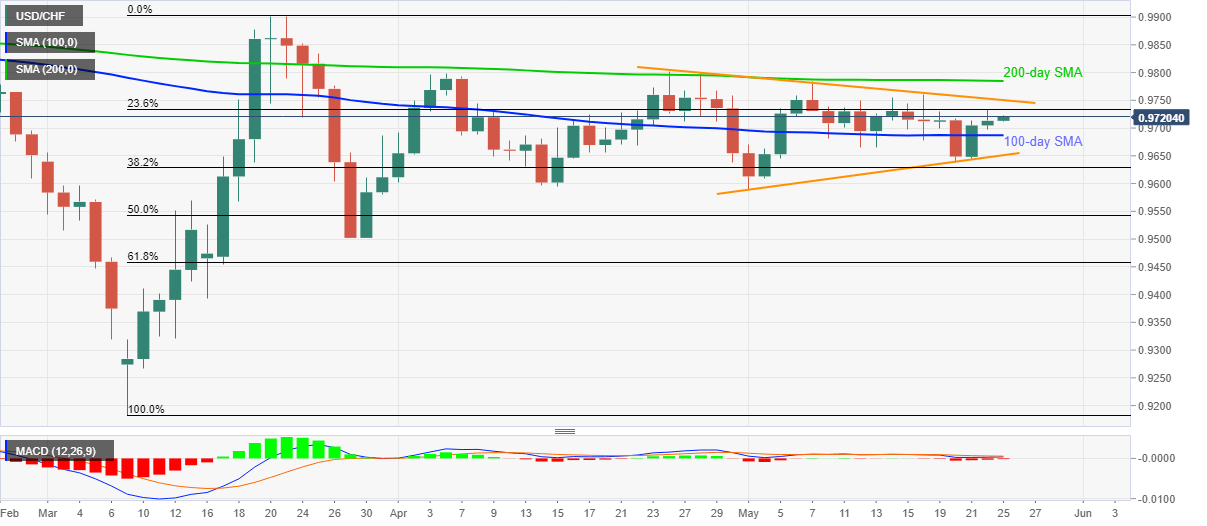
USD/CHF Price Analysis: Buyers regain control above 100-day SMA
by Anil Panchal- USD/CHF extends recovery moves from 0.9645, nears one-week high.
- Monthly resistance line, 200-day SMA question buyers.
- A three-week-old rising support line becomes the key during a fresh downside.
While extending its run-up past-100-day SMA, USD/CHF rises to 0.9720, up 0.08% on a day, during the early Monday.
Considering the pair’s sustained trading beyond key SMA, the pair is likely to again confront the monthly resistance line, at 0.9750 now, during the further upside.
However, the quote’s rise beyond 0.9750 needs validation from 200-day SMA, currently at 0.9785, for further upside.
Alternatively, a daily closing below 100-day SMA level of 0.9687 will pull the pair back to an ascending trend line from May 01, at 0.9650 now.
If at all the bears manage to keep the reins past-0.9650, the monthly lows near 0.9590/85 could be on their radars.
USD/CHF daily chart

Trend: Further recovery expected
Additional important levels
| Overview | |
|---|---|
| Today last price | 0.972 |
| Today Daily Change | 7 pips |
| Today Daily Change % | 0.07% |
| Today daily open | 0.9713 |
| Trends | |
|---|---|
| Daily SMA20 | 0.9708 |
| Daily SMA50 | 0.97 |
| Daily SMA100 | 0.9687 |
| Daily SMA200 | 0.9786 |
| Levels | |
|---|---|
| Previous Daily High | 0.9734 |
| Previous Daily Low | 0.9697 |
| Previous Weekly High | 0.9761 |
| Previous Weekly Low | 0.9638 |
| Previous Monthly High | 0.9803 |
| Previous Monthly Low | 0.9595 |
| Daily Fibonacci 38.2% | 0.972 |
| Daily Fibonacci 61.8% | 0.9711 |
| Daily Pivot Point S1 | 0.9696 |
| Daily Pivot Point S2 | 0.9678 |
| Daily Pivot Point S3 | 0.966 |
| Daily Pivot Point R1 | 0.9732 |
| Daily Pivot Point R2 | 0.9751 |
| Daily Pivot Point R3 | 0.9768 |