Microsoft Remains An Interesting Dividend Growth Play
by ValuentumSummary
- Microsoft's outlook is supported by growing demand for its productivity and cloud-computing offerings.
- Given its pristine balance sheet and high-quality cash flow profile, Microsoft has the financial capacity to continue pushing through per-share dividend increases if it chooses to do so.
- In this article, we cover our forecasts concerning Microsoft's future net operating cash flow and future free cash flow.
- At the top end of our fair value estimate range, we value Microsoft at $204 per share.

Image Source: Microsoft Corporation – Third Quarter of Fiscal 2020 Earnings IR PowerPoint Presentation
By Callum Turcan
In this article, we are following up on the last note we published on Seeking Alpha covering Microsoft Corp. (MSFT) that can be viewed here. Now that Microsoft has provided an update on its performance during the early stages of the ongoing coronavirus (COVID-19) pandemic, we wanted to highlight why the firm appears well-positioned to continue generating meaningful cash flow going forward. Please note we've recently updated our enterprise cash flow models covering Microsoft.
Future dividend increases will be made possible through its enormous (and growing) net cash position and high-quality cash flow profile, with shares of MSFT yielding ~1.1% as of this writing. Historically speaking, Microsoft tends to increase its quarterly dividend once every year (usually late in the calendar year), meaning its next payout increase is potentially right around the corner as the firm's quarterly payout has been flat at $0.51 per share over the past three quarters.
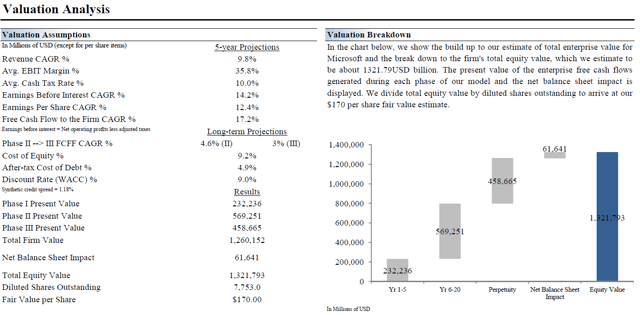
In the upcoming graphic down below, we cover the key assumptions used in our base-case scenario in our enterprise cash flow models covering Microsoft. Please note that should Microsoft outperform these assumptions, at the top of our fair value estimate range we value MSFT at $204 per share. To learn more about enterprise valuation and how to think about equity valuation, in general, please read the book Value Trap.

Image Shown: Under our base-case scenario, we give Microsoft a fair value estimate of $170 per share. Should Microsoft outperform the key valuation assumptions used in our base-case scenario, at the top end of our fair value estimate range we value MSFT at $204 per share. Image Source: Valuentum
Financial Update
From the end of fiscal 2019 (period ended June 30, 2019) to the end of the third quarter of fiscal 2020 (period ended March 31, 2020), Microsoft’s net cash position improved from $61.6 billion to $71.0 billion (defining net cash here as ‘total cash, cash equivalents, and short-term investments’ less ‘current portion of long-term debt’ and ‘long-term debt’).
As an aside, please note Microsoft’s equity method investment balance grew marginally during this period, hitting $2.7 billion at the end of March 2020 (arguably, some of these investments are cash-like). A growing cash-like balance combined with a shrinking total debt load led to Microsoft’s net cash position improving, which we strongly appreciate, especially given that the firm spent approximately $17.2 billion repurchasing its common stock and approximately $11.3 billion on its dividend obligations during the first nine months of fiscal 2020.
This was made possible through Microsoft’s impressive cash flow profile. Microsoft generated $42.0 billion in net operating cash flow and spent $10.7 billion on its capital expenditures during the first three quarters of fiscal 2020, allowing for $31.3 billion in free cash flow which fully covered both its share repurchases and its dividend obligations (combined, those activities consumed ~$28.55 billion in cash during this period).
Financial Forecasts
Going forward, we expect Microsoft’s net operating cash flow will continue to grow at a substantial clip, aided by its impressive cloud computing and productivity offerings. In the fiscal third quarter, Microsoft’s ‘server products and cloud services revenue’ jumped higher by 30% year over year, assisted by 59% growth at its Azure segment. That growth rate would have been even higher if not for foreign currency headwinds. Additionally, Microsoft’s ‘Office Commercial products and cloud services’ and ‘Office Consumer products and cloud services’ revenue streams were up 13% and 15% year over year, respectively, last fiscal quarter. Again, these growth rates would have been stronger if not for foreign currency headwinds, keeping in mind the US dollar has been quite strong of late.
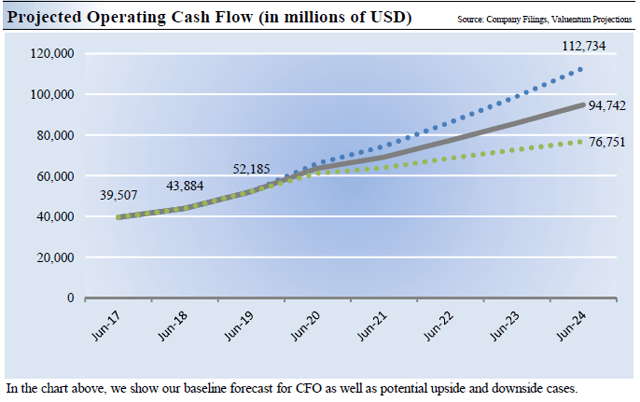
In the upcoming graphic down below, we highlight the forecasted growth trajectory of Microsoft’s net operating cash flow derived through our enterprise cash flow models. We model out a bear case (depicted by the green dots in the upcoming graphic), base case (grey line), and bull case (blue dots) scenario for each company in our coverage universe to provide a framework for how to evaluate a publicly-traded company versus a baseline (that baseline is represented by the key valuation assumptions used in the base-case scenario which we covered in the 'Valuation Analysis' graphic up above). Should a firm outperform or underperform the key valuation assumptions (such as expected revenue growth or operating margins), the bull case and bear case scenarios offer a way to view the trajectory of the cash flow of the firm in question.

Image Shown: Due to the strength of Microsoft’s cloud computing and productivity offerings, we are very optimistic about the growth trajectory of its net operating cash flow. Image Source: Valuentum
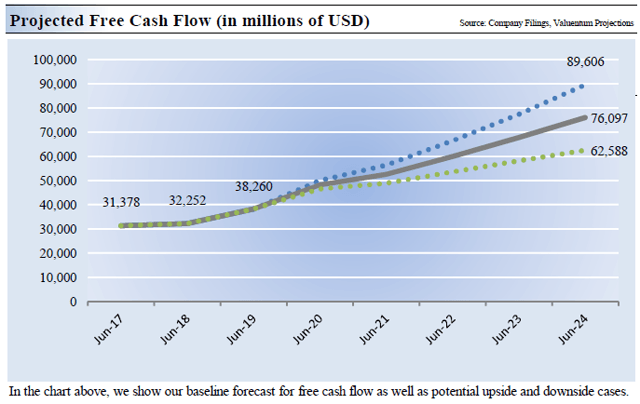
As Microsoft is a relatively capital-expenditure-light company (keeping in mind that has changed modestly over the past few years due to the need to develop data centers to support the ongoing shift towards a cloud computing-heavy tech environment), net operating cash flow growth tends to translate into free cash flow growth. Being relatively capital-expenditure-light means that a firm doesn’t need to spend significant amounts on capital investments to generate meaningful net operating cash flow. In the upcoming graphic down below, we highlight the forecasted trajectory of Microsoft’s free cash flow over the coming years under our bear case (green dots), base case (grey line), and bull case (blue dots) scenarios.

Image Shown: We expect Microsoft’s free cash flow will grow materially over the coming years. Image Source: Valuentum
Adapting to the COVID-19 Crisis
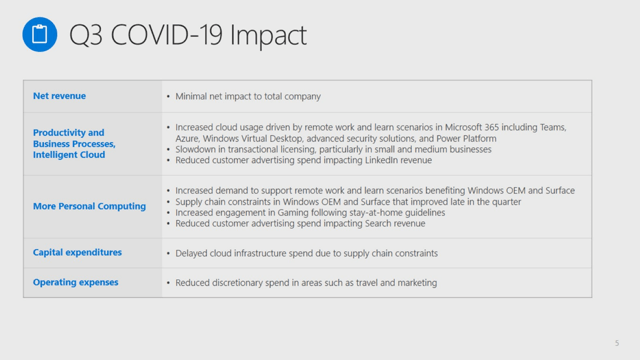
Microsoft isn’t immune to the economic downturn and the downturn in digital advertising. However, it should be able to continue generating meaningful cash flow going forward, given that its operations have largely continued during the crisis. As a tech giant, many of Microsoft’s employees have been able to keep working from home, allowing the firm to develop new products while supporting and maintaining its existing offerings. The rising need for offsite computing power on an enterprise-level supports the demand outlook for many of its products and services. In the upcoming graphic down below, Microsoft lays out how the pandemic impacted its performance last fiscal quarter and what the firm is doing to offset the negative effects of the crisis.

Image Shown: An overview of how Microsoft coped with the COVID-19 pandemic in the fiscal third quarter and what to expect going forward. Image Source: Microsoft – Third Quarter of Fiscal 2020 Earnings IR PowerPoint Presentation
Here’s what Microsoft’s CFO Amy Hood had to say during the firm’s latest quarterly conference call as it relates to the company’s outlook given the ongoing pandemic:
Now let's move to our outlook, starting with our expectations for COVID-19-related impact. In our consumer business, we expect continued demand across Windows OEM, Surface and Gaming from the shift to remote work, play and learn from home. Our outlook assumes this benefit remains through much of Q4, though growth rates may be impacted as stay-at-home guidelines ease. We assume advertising spend levels from March do not improve in Q4, which will impact Search and LinkedIn. In our commercial business, our strong position in durable growth markets means we expect consistent execution on a large annuity base, with continued usage and consumption growth across our cloud offerings. However, we expect the sales dynamics from March to continue, including a significant impact in LinkedIn from the weak job market and increased volatility in new longer lead time deal closures. In commercial bookings, growth from healthy renewal execution on a larger Q4 expiry base will be impacted by some large commitments in the prior year and the previously mentioned sales dynamics. Commercial cloud gross margin percentage will be relatively changed year-over-year as continued improvement in IaaS and PaaS gross margin percentage will be more than offset by revenue mix shift to Azure. And with the supply chain constraints easing, we expect a material sequential increase in our capital expenditures to support growing usage and demand for our cloud services.
Concluding Thoughts
The strong technical performance seen in Microsoft’s stock price of late is largely due to the firm’s ability to quickly adapt to the changing landscape created by COVID-19. While LinkedIn is facing pressures from the deteriorating digital advertising market at least in the short term (in our view, digital advertising spending will bounce back quickly once the global economy begins to restart in earnest), Microsoft will lean on its core businesses (namely productivity products like Office and cloud-computing offerings like Azure) to continue generating meaningful free cash flow going forward.
Microsoft's pristine balance sheet is an immense source of strength during these harrowing times. A strong balance sheet combined with its high-quality cash flow profile gives Microsoft the financial capacity to continue pushing forward with material payout increases should management decide the firm wants to maintain its status as a dividend growth player.
Disclosure: I/we have no positions in any stocks mentioned, and no plans to initiate any positions within the next 72 hours. I wrote this article myself, and it expresses my own opinions. I am not receiving compensation for it (other than from Seeking Alpha). I have no business relationship with any company whose stock is mentioned in this article.
Additional disclosure: This article or report and any links within are for information purposes only and should not be considered a solicitation to buy or sell any security. Valuentum is not responsible for any errors or omissions or for results obtained from the use of this article and accepts no liability for how readers may choose to utilize the content. Assumptions, opinions, and estimates are based on our judgment as of the date of the article and are subject to change without notice.