NZD/USD Price Analysis: Sellers look for entry below 0.6080/75 support confluence
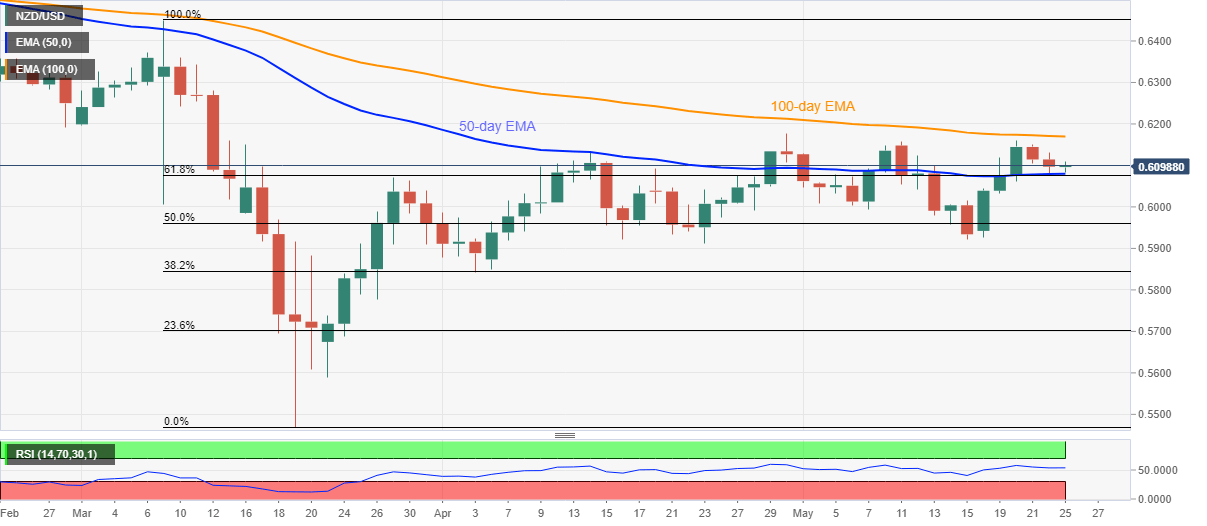
by Anil Panchal- NZD/USD struggles for a clear direction below 100-day EMA.
- 50-day EMA, 61.8% Fibonacci retracement limits immediate downside.
- April top adds to the upside barrier.
NZD/USD again attempts recovery towards 0.6100 while bouncing off 0.6083 during Monday’s Asian session. Even so, the pair stays below 100-day EMA after the recent two-day losing streak.
While the pair’s repeated failures to break 100-day EMA keeps the sellers hopeful, a clear downside below 0.6080/75 support confluence, comprising 50-day EMA and 61.8% Fibonacci retracement of March month fall, becomes the key for fresh entry.
If at all the NZD/USD prices slip below 0.6075, 0.6000 could gain the bears’ attention ahead of the monthly low near 0.5920.
Alternatively, an upside clearance of a 100-day EMA level of 0.6170 could propel the quote towards April month high nearing 0.6175/80.
NZD/USD daily chart

Trend: Sideways
Additional important levels
| Overview | |
|---|---|
| Today last price | 0.6099 |
| Today Daily Change | 2 pips |
| Today Daily Change % | 0.03% |
| Today daily open | 0.6097 |
| Trends | |
|---|---|
| Daily SMA20 | 0.6066 |
| Daily SMA50 | 0.5995 |
| Daily SMA100 | 0.622 |
| Daily SMA200 | 0.6321 |
| Levels | |
|---|---|
| Previous Daily High | 0.6131 |
| Previous Daily Low | 0.608 |
| Previous Weekly High | 0.6159 |
| Previous Weekly Low | 0.5927 |
| Previous Monthly High | 0.6176 |
| Previous Monthly Low | 0.5843 |
| Daily Fibonacci 38.2% | 0.6099 |
| Daily Fibonacci 61.8% | 0.6112 |
| Daily Pivot Point S1 | 0.6074 |
| Daily Pivot Point S2 | 0.6052 |
| Daily Pivot Point S3 | 0.6023 |
| Daily Pivot Point R1 | 0.6125 |
| Daily Pivot Point R2 | 0.6154 |
| Daily Pivot Point R3 | 0.6176 |