NewsBTC
The Signal That Preceded Bitcoin’s Drop to $3k in 2018 Is About to Flash Again
by Nick ChongJust a week ago, Bitcoin was trading just dollars shy from $10,000. But after rumors (since disproven) spread about Satoshi Nakamoto selling his stash of BTC, the cryptocurrency has collapsed to $8,700.
Some have deemed this move a “healthy” retracement, but a key indicator suggests that Bitcoin bulls have further losses ahead of themselves.
Related Reading: Crypto Tidbits: Satoshi Isn’t Dumping His Bitcoin, China ‘Bans’ Cryptocurrency Mining
Bitcoin Is About to Print a Hash Ribbons Crossover
Due to the block reward halving that transpired two weeks ago, the revenue that Bitcoin miners earn was effectively cut in half overnight.
Miners operating with tight margins due to high electricity costs and older mining machines have been forced to turn off their machines in the wake of this halving.
As a result, Bitcoin’s hash rate — the amount of computational power securing the network — has fallen, dipping over 20% from the all-time highs.
It’s a decline that is about to be made apparent by the Hash Ribbons — a custom indicator that tracks crossovers in two moving averages of the hash rate. The indicator is now on the verge of crossing over to the downside — a sign seen just weeks before BTC crashed from $6,000 to $3,150 at the end of the 2018 bear market.
The Hash Ribbons crossing over to the downside, analysts say, indicates the existence of “miner capitulation.” The analysts say that during said capitulation, some Bitcoin miners are unprofitable, and are thus forced to sell their BTC to keep their operations online or out of debt.
Adding to the bearish outlook is technical analysis.
As reported by NewsBTC previously, one trader noted that Bitcoin’s weekly chart printed a textbook “tweezers” top, marked by two candles with the same body length in succession. Add a rejection at a key resistance level, $10,000, and the cryptocurrency is purportedly primed to move lower.
Bullish Long-Term Ramifications
Although many may be running for the doors due to the imminence of this on-chain signal, it has long-term bullish ramifications for the Bitcoin market.
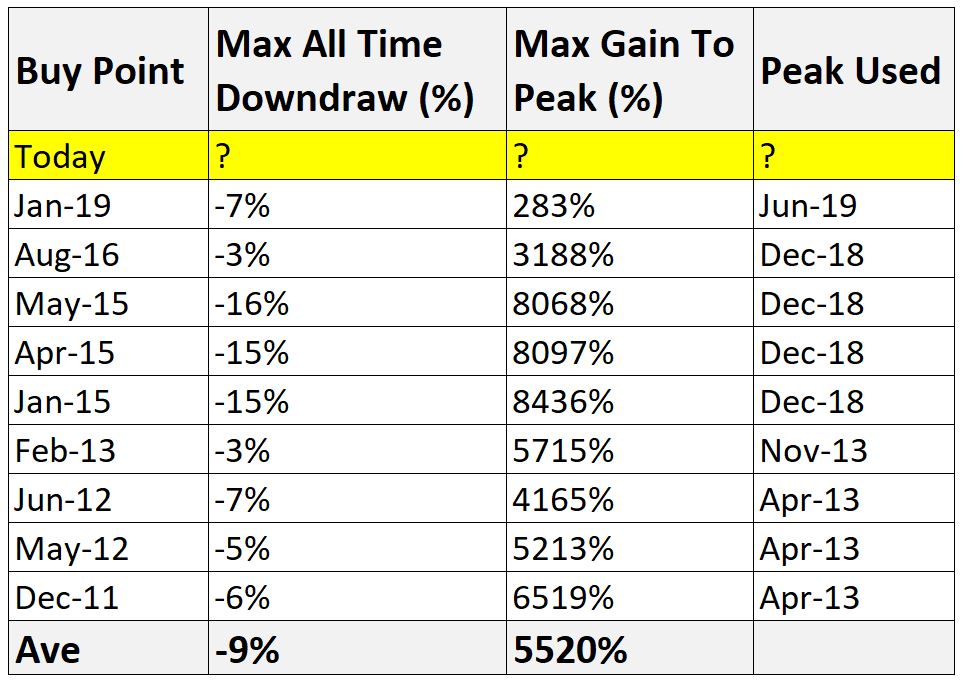
Digital asset analyst Charles Edwards found that whenever the Hash Ribbons recovers — when the short-term moving average crosses above the long-term moving average — has always been a good time to enter the crypto market. He wrote in December 2019:
“Hash Ribbons Buy confirmed. This is just the 10th time these conditions have been met for BTC. All other occasions saw an average gain-to-cycle-peak of +5000%.”

Related Reading: The Chinese Yuan is Falling Once Again — and That’s Key for the Bitcoin Bull Case
Featured Image from Shutterstock