USD/CAD Price Analysis: Bounces off 200-hour EMA to probe 1.4000
by Anil Panchal- USD/CAD extends pullback moves from 1.3980.
- 61.8% of Fibonacci retracement acts as immediate resistance.
- A three-day-old rising trend line, recovery from the key EMA keep buyers hopeful.
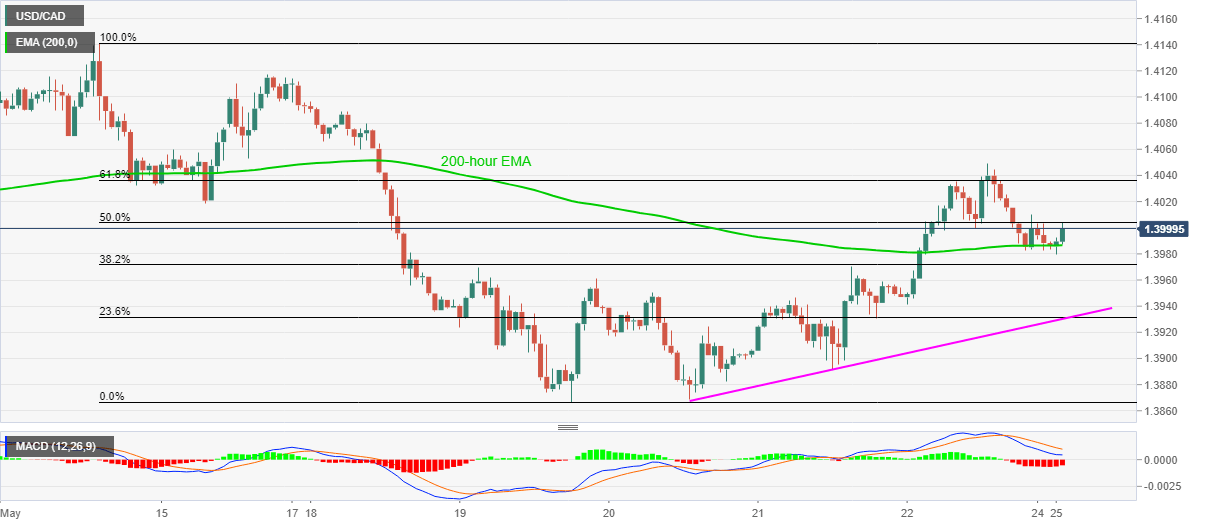
USD/CAD takes the bids near 1.4000, up 0.05% on a day, during the early Monday’s trading. Despite failing to cross 1.4050 resistance, the pair’s recent bounce from 200-hour EMA keeps buyers hopeful.
That said, bulls may again target 1.4050 resistance while also aiming 61.8% Fibonacci retracement of May 14-19 fall, around 1.4035 as immediate upside barrier.
In a case where the buyers manage to dominate past-1.4050, 1.4100, 1.4120 and May 14 top near 1.4140 could return to the charts.
On the downside, the pair’s break of a 200-hour EMA level of 1.3985 can drag it back to a short-term support line near 1.3930.
Though, 1.3900 round-figure and May 19 low near 1.3870/65 could challenge the bears afterward.
USD/CAD hourly chart

Trend: Further recovery expected
Additional important levels
| Overview | |
|---|---|
| Today last price | 1.399 |
| Today Daily Change | -10 pips |
| Today Daily Change % | -0.07% |
| Today daily open | 1.4 |
| Trends | |
|---|---|
| Daily SMA20 | 1.4011 |
| Daily SMA50 | 1.4089 |
| Daily SMA100 | 1.368 |
| Daily SMA200 | 1.3446 |
| Levels | |
|---|---|
| Previous Daily High | 1.4049 |
| Previous Daily Low | 1.3942 |
| Previous Weekly High | 1.4114 |
| Previous Weekly Low | 1.3867 |
| Previous Monthly High | 1.4299 |
| Previous Monthly Low | 1.385 |
| Daily Fibonacci 38.2% | 1.4008 |
| Daily Fibonacci 61.8% | 1.3982 |
| Daily Pivot Point S1 | 1.3944 |
| Daily Pivot Point S2 | 1.3889 |
| Daily Pivot Point S3 | 1.3837 |
| Daily Pivot Point R1 | 1.4052 |
| Daily Pivot Point R2 | 1.4104 |
| Daily Pivot Point R3 | 1.4159 |