GBP/USD Price Analysis: Portrays falling wedge on hourly chart below 1.2200
by Anil Panchal- GBP/SD extends recoveries from 1.2162 to intraday high of 1.2191.
- 200-HMA adds to the upside resistance.
- Bears can refresh monthly low amid a gradual weakening.
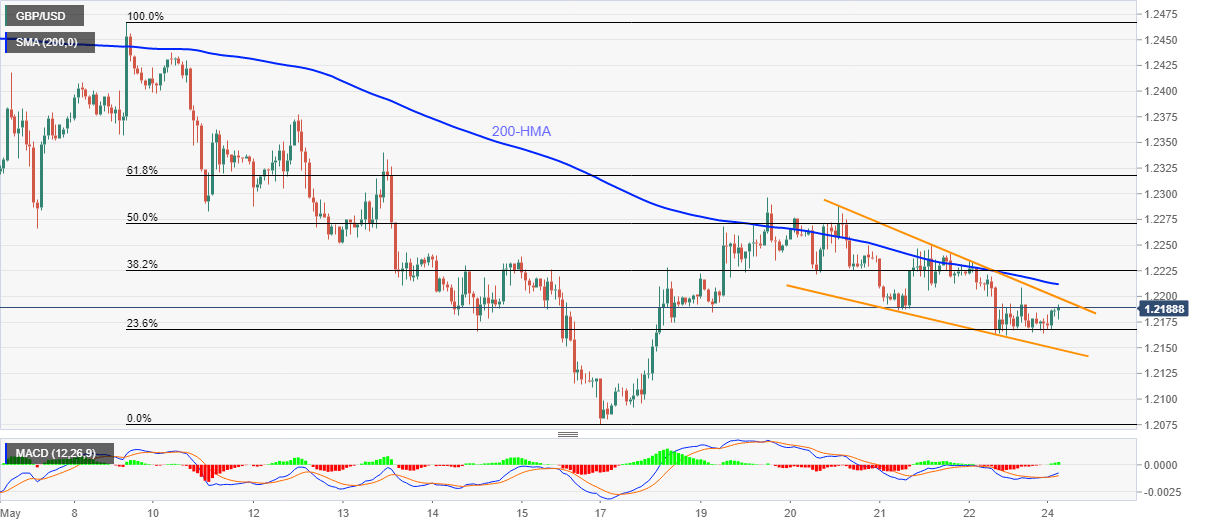
GBP/USD rises to 1.2191, up 0.15% on a day, during Monday’s Asian session. In doing so, the Cable pair extends its recoveries from Friday’s low of 1.2162 while staying inside a bullish chart formation.
Considering the pair’s sustained trading below 200-HMA, bulls are less likely to enter immediately on the upside break of falling wedge resistance, at 1.2200 now.
However, a successful break of 1.2215, comprising 200-HMA, could propel the quote towards the last weekly top near 1.2300.
Meanwhile, a downside break below the formation’s support line of 1.2148 could challenge the monthly low near 1.2075.
Though, the pair’s extended fall below 1.2075 might not hesitate to challenge 1.2000 round-figures.
GBP/USD hourly chart

Trend: Bearish
Additional important levels
| Overview | |
|---|---|
| Today last price | 1.2188 |
| Today Daily Change | 14 pips |
| Today Daily Change % | 0.11% |
| Today daily open | 1.2174 |
| Trends | |
|---|---|
| Daily SMA20 | 1.2334 |
| Daily SMA50 | 1.2274 |
| Daily SMA100 | 1.2623 |
| Daily SMA200 | 1.2666 |
| Levels | |
|---|---|
| Previous Daily High | 1.2234 |
| Previous Daily Low | 1.2162 |
| Previous Weekly High | 1.2296 |
| Previous Weekly Low | 1.2076 |
| Previous Monthly High | 1.2648 |
| Previous Monthly Low | 1.2165 |
| Daily Fibonacci 38.2% | 1.2189 |
| Daily Fibonacci 61.8% | 1.2206 |
| Daily Pivot Point S1 | 1.2146 |
| Daily Pivot Point S2 | 1.2118 |
| Daily Pivot Point S3 | 1.2074 |
| Daily Pivot Point R1 | 1.2218 |
| Daily Pivot Point R2 | 1.2262 |
| Daily Pivot Point R3 | 1.229 |