US Dollar Index Price Analysis: DXY grinds to fresh 2020 highs, challenges 99.20 resistance
by Flavio Tosti- DXY is holding above the 99.00 figure as the index is printing fresh 2020 highs by a few ticks this Friday.
- The level to beat for bulls is the 99.20 resistance.
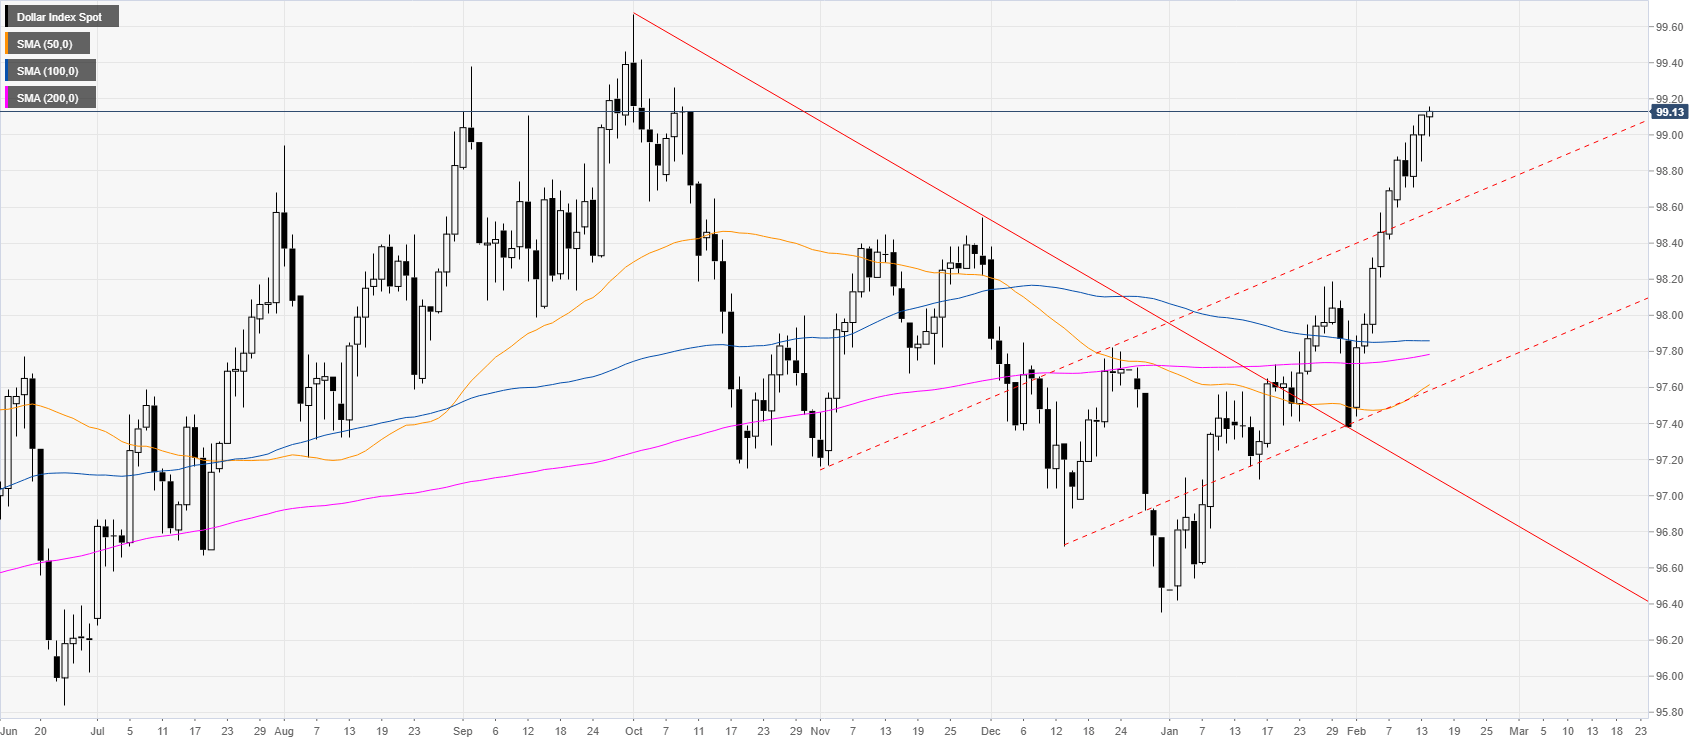
DXY daily chart
The US dollar index (DXY) is trading near its highest since October while trading well above its main daily simple moving averages (SMAs). DXY is spiking to the upside printing a fresh 2020 high by a few ticks this Friday.

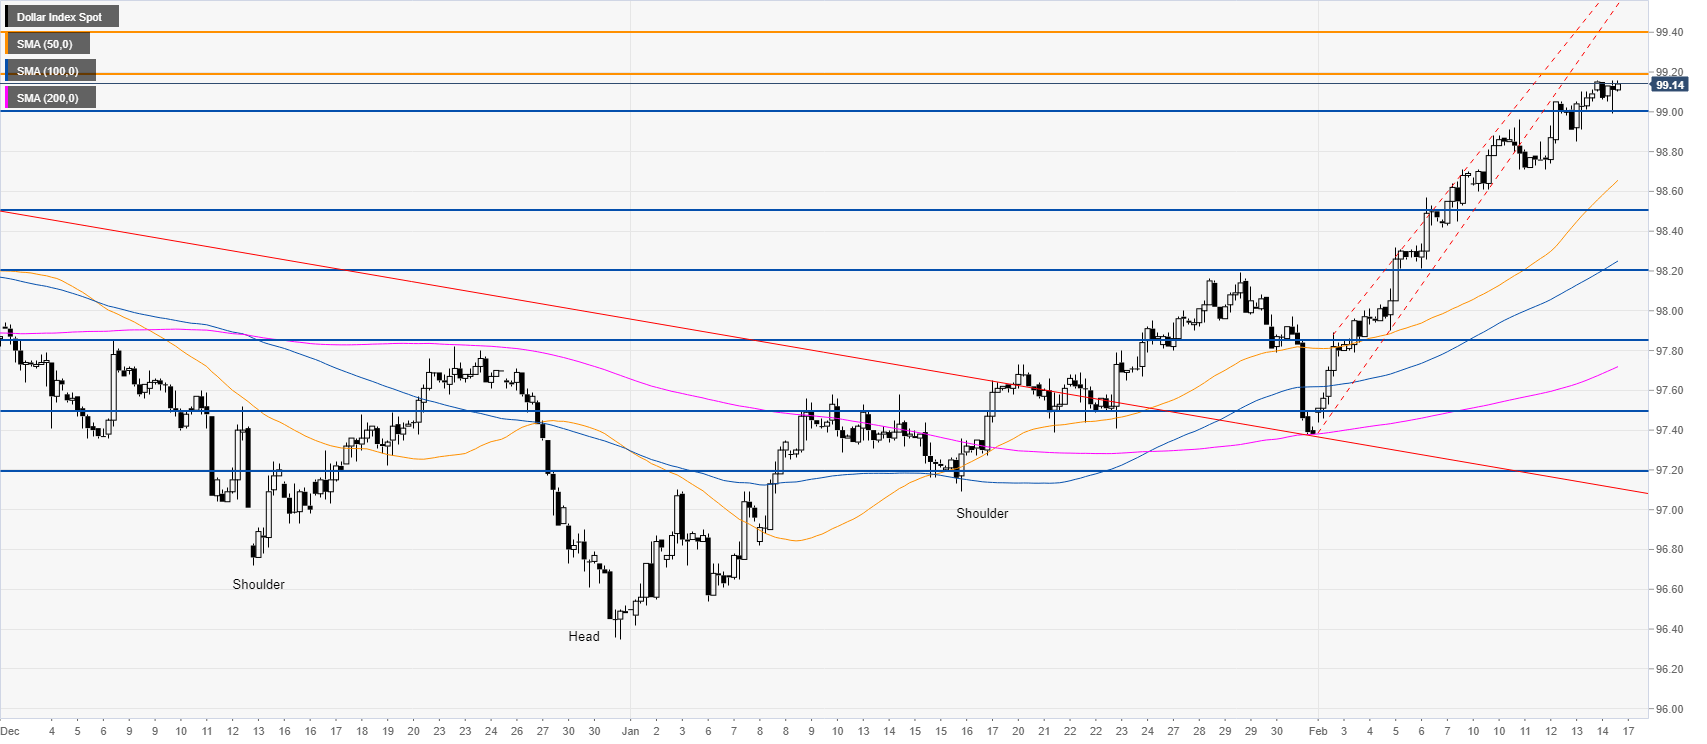
DXY four-hour chart
DXY is holding above the 99.00 figure as the market is trading well above its main SMAs. The bulls remain relentless as the market keeps grinding to the upside. Buyers are looking for a break above the 99.20 resistance to trade towards the 99.40 level. Support is seen at the 99.00 figure and 98.50 level.

Additional key levels
Dollar Index Spot
| Overview | |
|---|---|
| Today last price | 99.14 |
| Today Daily Change | 0.03 |
| Today Daily Change % | 0.03 |
| Today daily open | 99.11 |
| Trends | |
|---|---|
| Daily SMA20 | 98.1 |
| Daily SMA50 | 97.59 |
| Daily SMA100 | 97.86 |
| Daily SMA200 | 97.77 |
| Levels | |
|---|---|
| Previous Daily High | 99.11 |
| Previous Daily Low | 98.85 |
| Previous Weekly High | 98.71 |
| Previous Weekly Low | 97.44 |
| Previous Monthly High | 98.19 |
| Previous Monthly Low | 96.42 |
| Daily Fibonacci 38.2% | 99.01 |
| Daily Fibonacci 61.8% | 98.95 |
| Daily Pivot Point S1 | 98.94 |
| Daily Pivot Point S2 | 98.76 |
| Daily Pivot Point S3 | 98.68 |
| Daily Pivot Point R1 | 99.2 |
| Daily Pivot Point R2 | 99.28 |
| Daily Pivot Point R3 | 99.46 |