USD/CHF Price Analysis: Greenback off fresh 2020 highs, trades above 0.9800 figure
by Flavio Tosti- USD/CHF bulls are keeping the market above the 0.9800 figure.
- The rising wedge pattern can limit extra gains on USD/CHF.
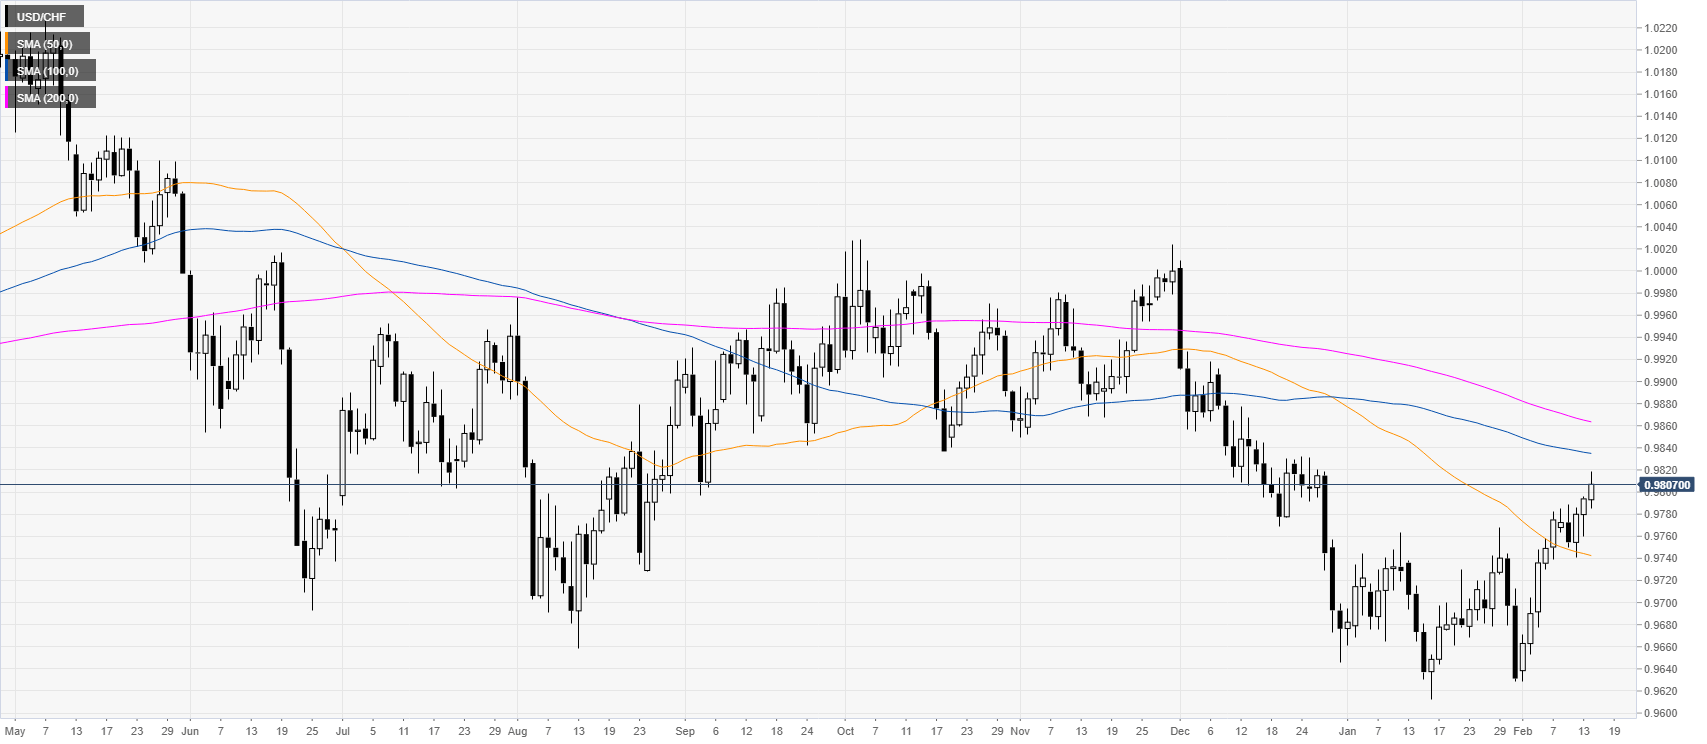
USD/CHF daily chart
USD/CHF is easing after hitting new 2020 highs this Friday. The quote is trading below the 100/200-day simple moving averages suggesting an overall bearish bias.

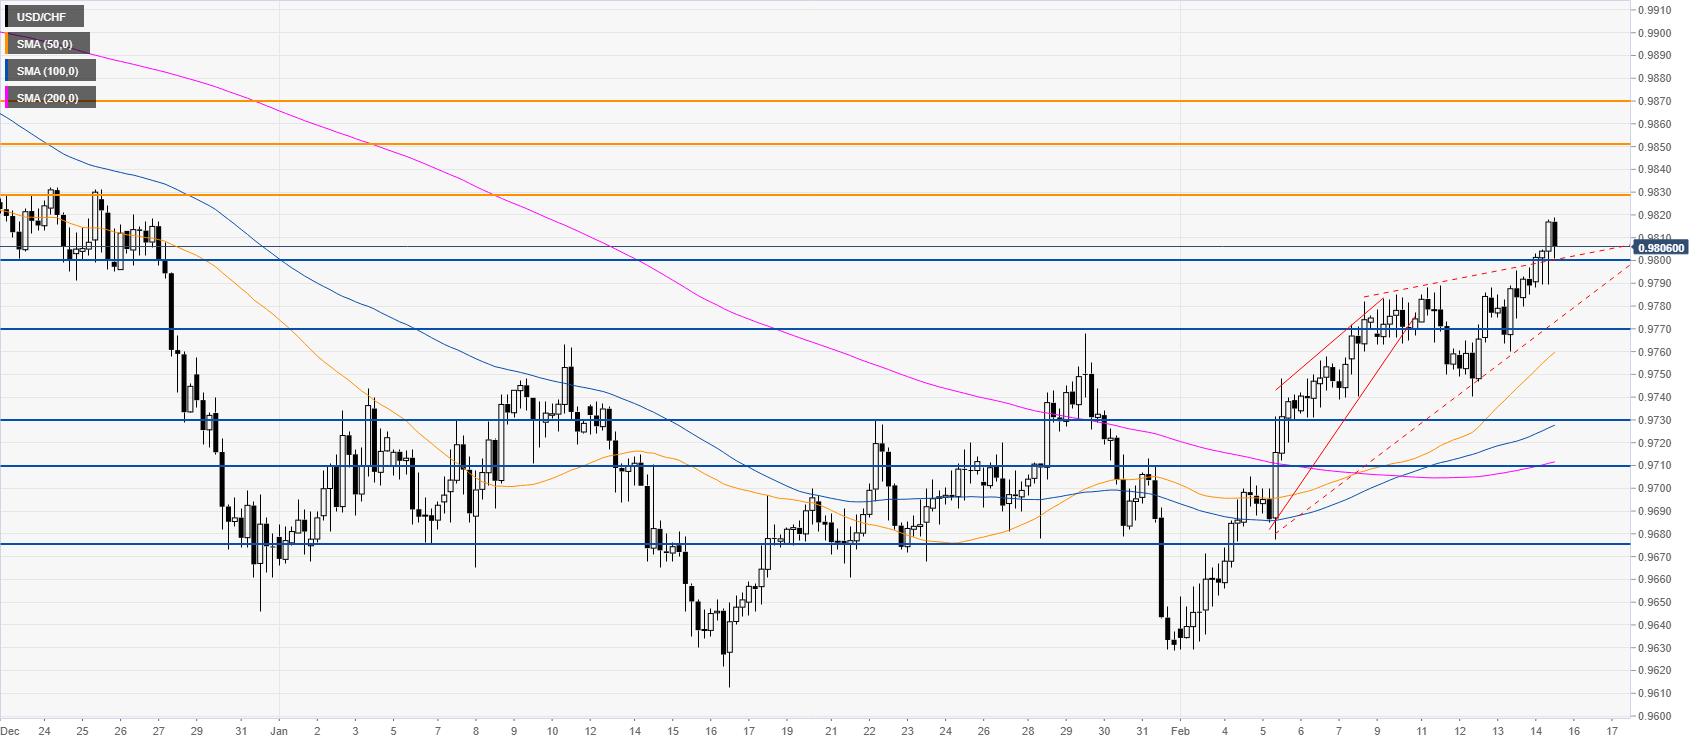
USD/CHF four-hour chart
The market broke above the 0.9800 figure and the rising wedge upper trendline. If bulls maintain the market above the 0.9800 figure it would be considered a bullish sign which can lead to further gains towards the 0.9830 and 0.9850 levels. On the flip side, a daily close below the 0.9800 figure could see a re-integration of the wedge with a potential decline towards the 0.9770 level.

Resistance: 0.9830, 0.9850, 0.9870
Support: 0.9800, 0.9770, 0.9730
Additional key levels
USD/CHF
| Overview | |
|---|---|
| Today last price | 0.9803 |
| Today Daily Change | 0.0009 |
| Today Daily Change % | 0.09 |
| Today daily open | 0.9794 |
| Trends | |
|---|---|
| Daily SMA20 | 0.9717 |
| Daily SMA50 | 0.9744 |
| Daily SMA100 | 0.9836 |
| Daily SMA200 | 0.9866 |
| Levels | |
|---|---|
| Previous Daily High | 0.9796 |
| Previous Daily Low | 0.976 |
| Previous Weekly High | 0.9782 |
| Previous Weekly Low | 0.9629 |
| Previous Monthly High | 0.9768 |
| Previous Monthly Low | 0.9613 |
| Daily Fibonacci 38.2% | 0.9782 |
| Daily Fibonacci 61.8% | 0.9774 |
| Daily Pivot Point S1 | 0.9771 |
| Daily Pivot Point S2 | 0.9748 |
| Daily Pivot Point S3 | 0.9735 |
| Daily Pivot Point R1 | 0.9806 |
| Daily Pivot Point R2 | 0.9819 |
| Daily Pivot Point R3 | 0.9842 |