Gold Price Analysis: XAU/USD trading in 10-day highs near $1580.00/oz
by Flavio Tosti- XAU/USD is gaining steam as the week is coming to an end.
- Bulls are eying the 1590.05 and 1595.00 levels on the way up.
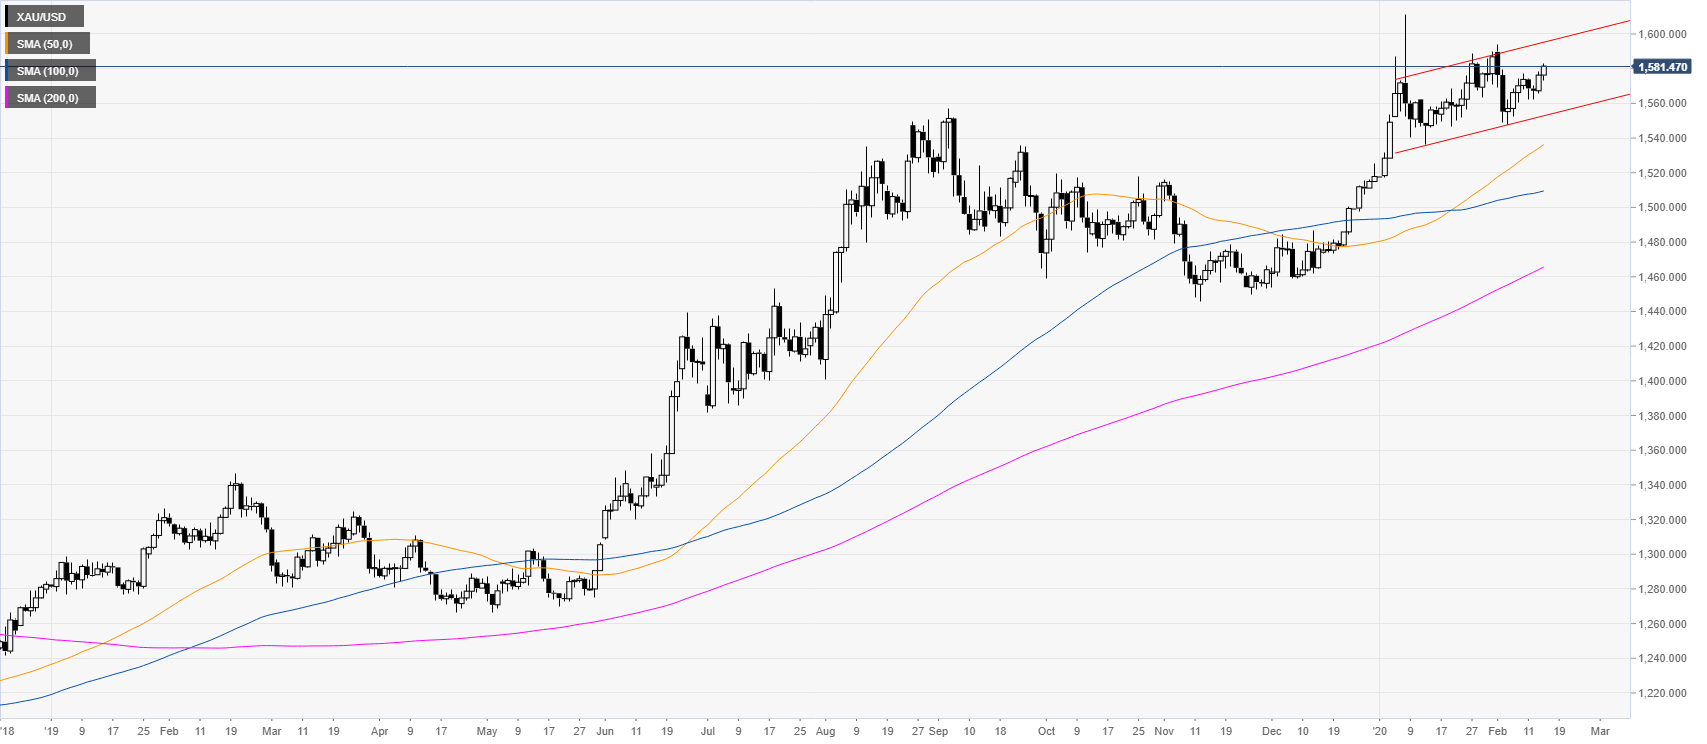
Gold daily chart
XAU/USD is trading in a bull trend above the main daily simple moving averages (SMAs). Gold is rising in a bull channel while the market is being supported above the 1560.00 figure.

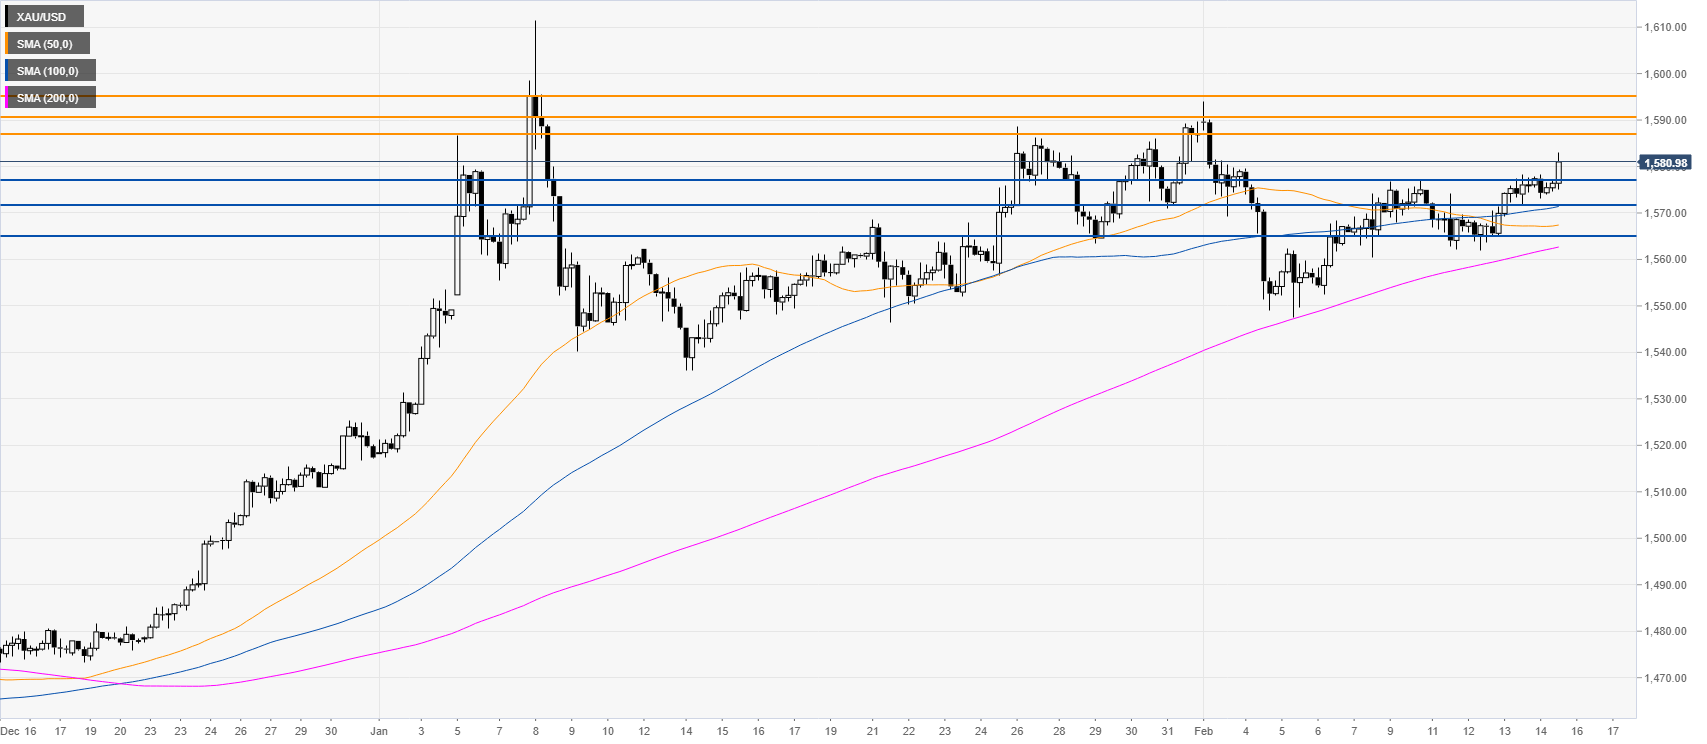
Gold four-hour chart
XAU/USD broke above the1576.75 support while trading above the main SMAs on the four-hour chart suggesting a bullish momentum in the medium term. As bulls are back in control the market has room to appreciate towards the 1590.05 and 1595.00 price levels. Conversely, corrections down could find support near the 1576.88, 1571.94 and 1565.36 levels, according to the Technical Confluences Indicator.

Resistance: 1586.75, 1590.05, 1595.00
Support: 1576.88, 1571.94, 1565.36
Additional key levels
XAU/USD
| Overview | |
|---|---|
| Today last price | 1581.08 |
| Today Daily Change | 4.77 |
| Today Daily Change % | 0.30 |
| Today daily open | 1576.31 |
| Trends | |
|---|---|
| Daily SMA20 | 1568.68 |
| Daily SMA50 | 1534.24 |
| Daily SMA100 | 1508.35 |
| Daily SMA200 | 1464.9 |
| Levels | |
|---|---|
| Previous Daily High | 1578.34 |
| Previous Daily Low | 1565.54 |
| Previous Weekly High | 1594.01 |
| Previous Weekly Low | 1547.56 |
| Previous Monthly High | 1611.53 |
| Previous Monthly Low | 1517.1 |
| Daily Fibonacci 38.2% | 1573.45 |
| Daily Fibonacci 61.8% | 1570.43 |
| Daily Pivot Point S1 | 1568.45 |
| Daily Pivot Point S2 | 1560.6 |
| Daily Pivot Point S3 | 1555.65 |
| Daily Pivot Point R1 | 1581.25 |
| Daily Pivot Point R2 | 1586.2 |
| Daily Pivot Point R3 | 1594.05 |