EUR/USD New York Price Forecast: Euro off 34-month lows post-US Retail Sales
by Flavio Tosti- EUR/USD bear trend remains, for now, intact as sellers remain in control near 34-month lows.
- EUR/USD is ticking up after slightly disappointing Retail Sales data from the US.
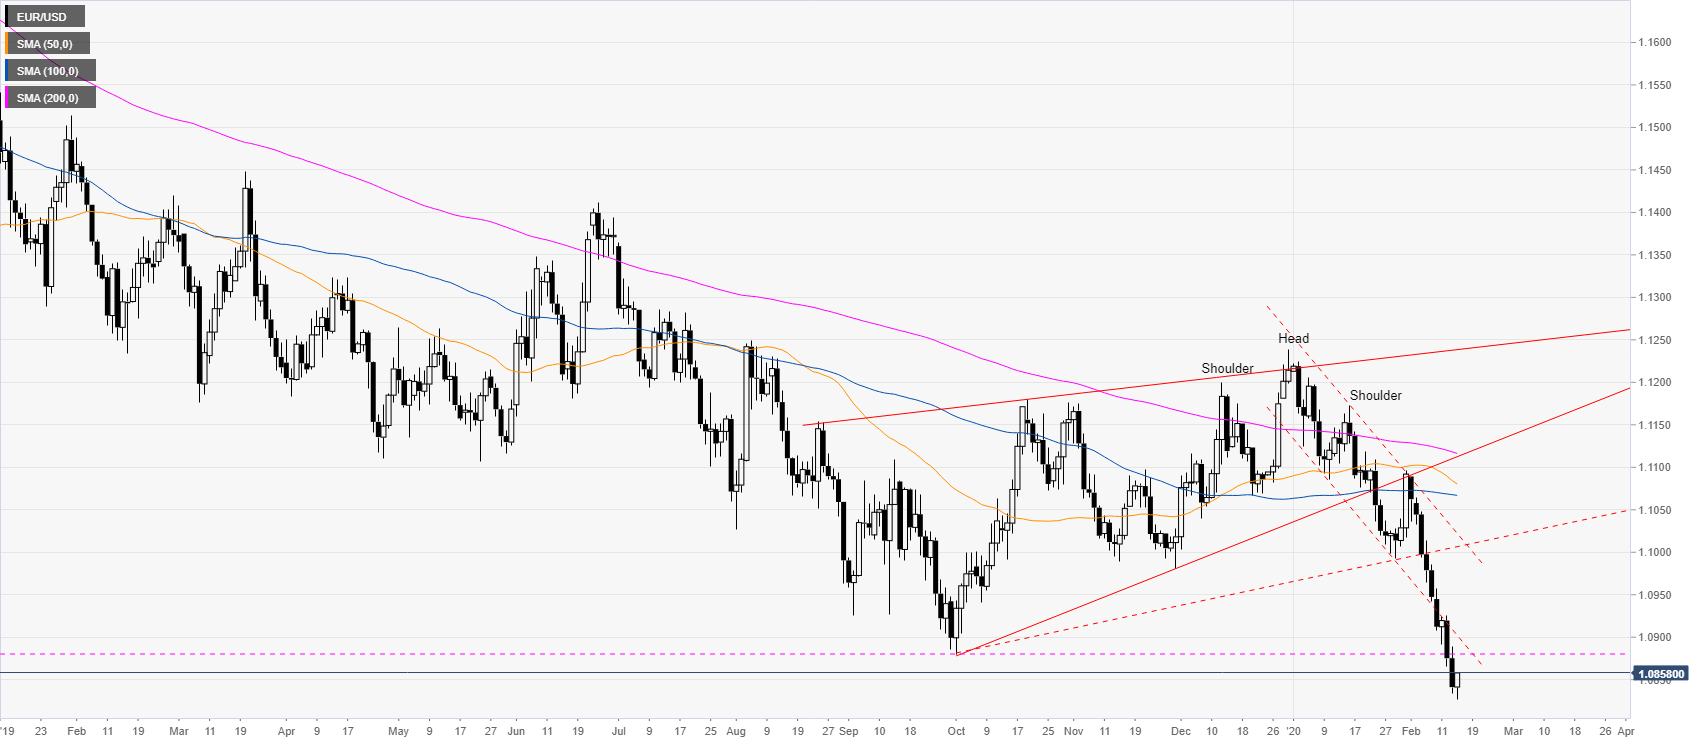
EUR/USD daily chart
EUR/USD is trading in a weak bear trend below the main daily simple moving averages (SMAs) as the quote is bouncing off 34-month lows. The US Retail Sales Control Group in January came in slightly below expectation at 0% vs. 0.3% forecast sending USD down little and made EUR/USD tick up.

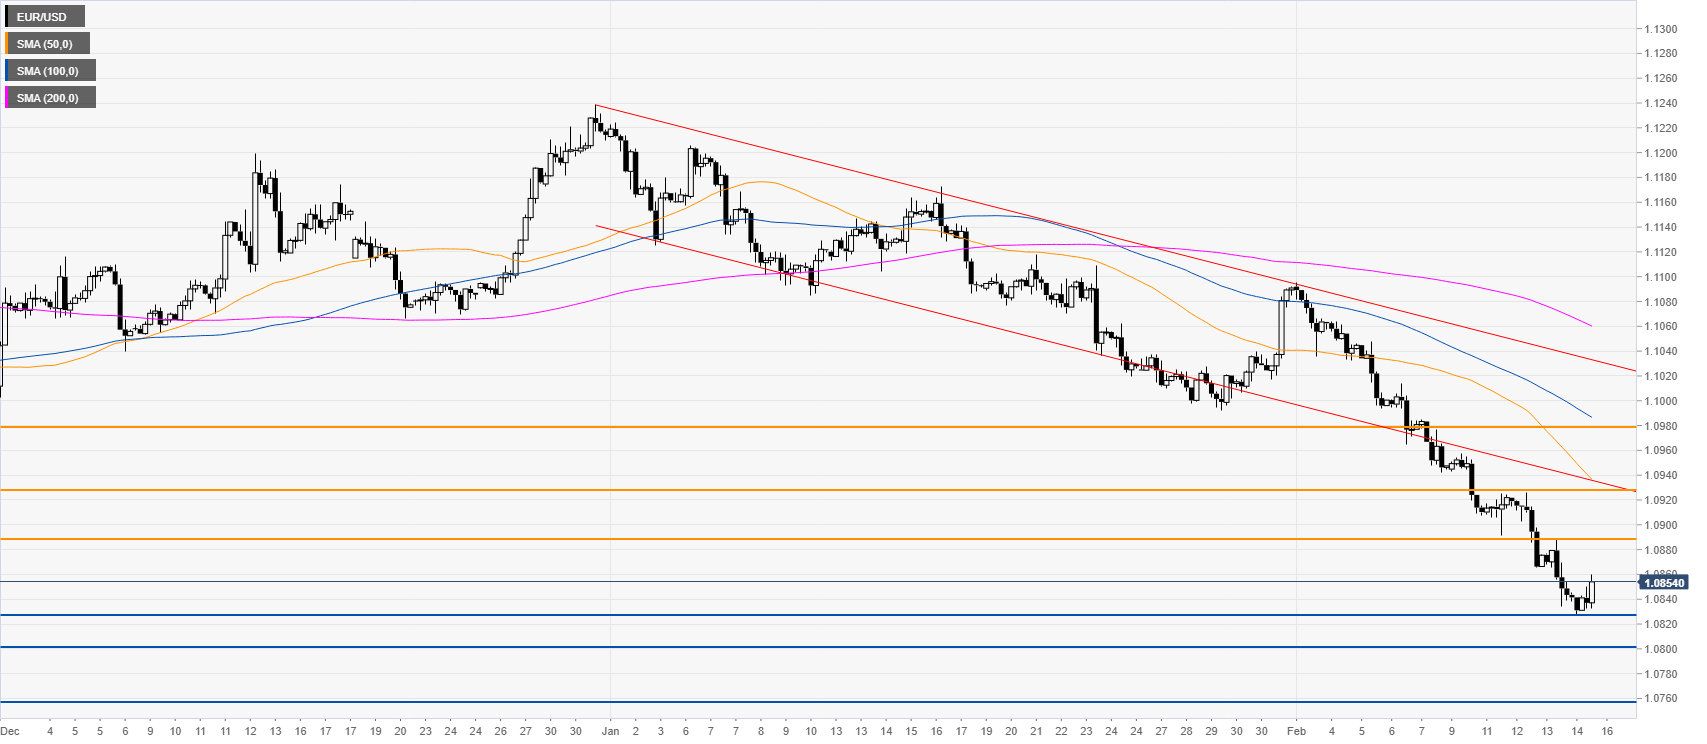
EUR/USD four-hour chart
EUR/USD broke below the downward channel while trading well below its main SMAs on the four-hour chart. The market remains under selling pressure near 34-month lows as bears want to break below the 1.0826 support level. Further down lie the 1.0800 figure and 1.0756 price level. Resistances are seen near the 1.0882, 1.0930 and 1.0984 levels, according to the Technical Confluences Indicator.

Resistance: 1.0882, 1.0930, 1.0984
Support: 1.0826, 1.0800, 1.0756
Additional key levels
EUR/USD
| Overview | |
|---|---|
| Today last price | 1.0855 |
| Today Daily Change | 0.0014 |
| Today Daily Change % | 0.13 |
| Today daily open | 1.0841 |
| Trends | |
|---|---|
| Daily SMA20 | 1.101 |
| Daily SMA50 | 1.1084 |
| Daily SMA100 | 1.1067 |
| Daily SMA200 | 1.1117 |
| Levels | |
|---|---|
| Previous Daily High | 1.0889 |
| Previous Daily Low | 1.0834 |
| Previous Weekly High | 1.1089 |
| Previous Weekly Low | 1.0942 |
| Previous Monthly High | 1.1225 |
| Previous Monthly Low | 1.0992 |
| Daily Fibonacci 38.2% | 1.0855 |
| Daily Fibonacci 61.8% | 1.0868 |
| Daily Pivot Point S1 | 1.0821 |
| Daily Pivot Point S2 | 1.08 |
| Daily Pivot Point S3 | 1.0766 |
| Daily Pivot Point R1 | 1.0875 |
| Daily Pivot Point R2 | 1.091 |
| Daily Pivot Point R3 | 1.093 |