USD/INR New York Price Forecast: Greenback looking for directions vs. rupee
by Flavio Tosti- USD/INR remains trapped in a tight range as the week comes to an end.
- The level to beat for bears is the 71.20 support.
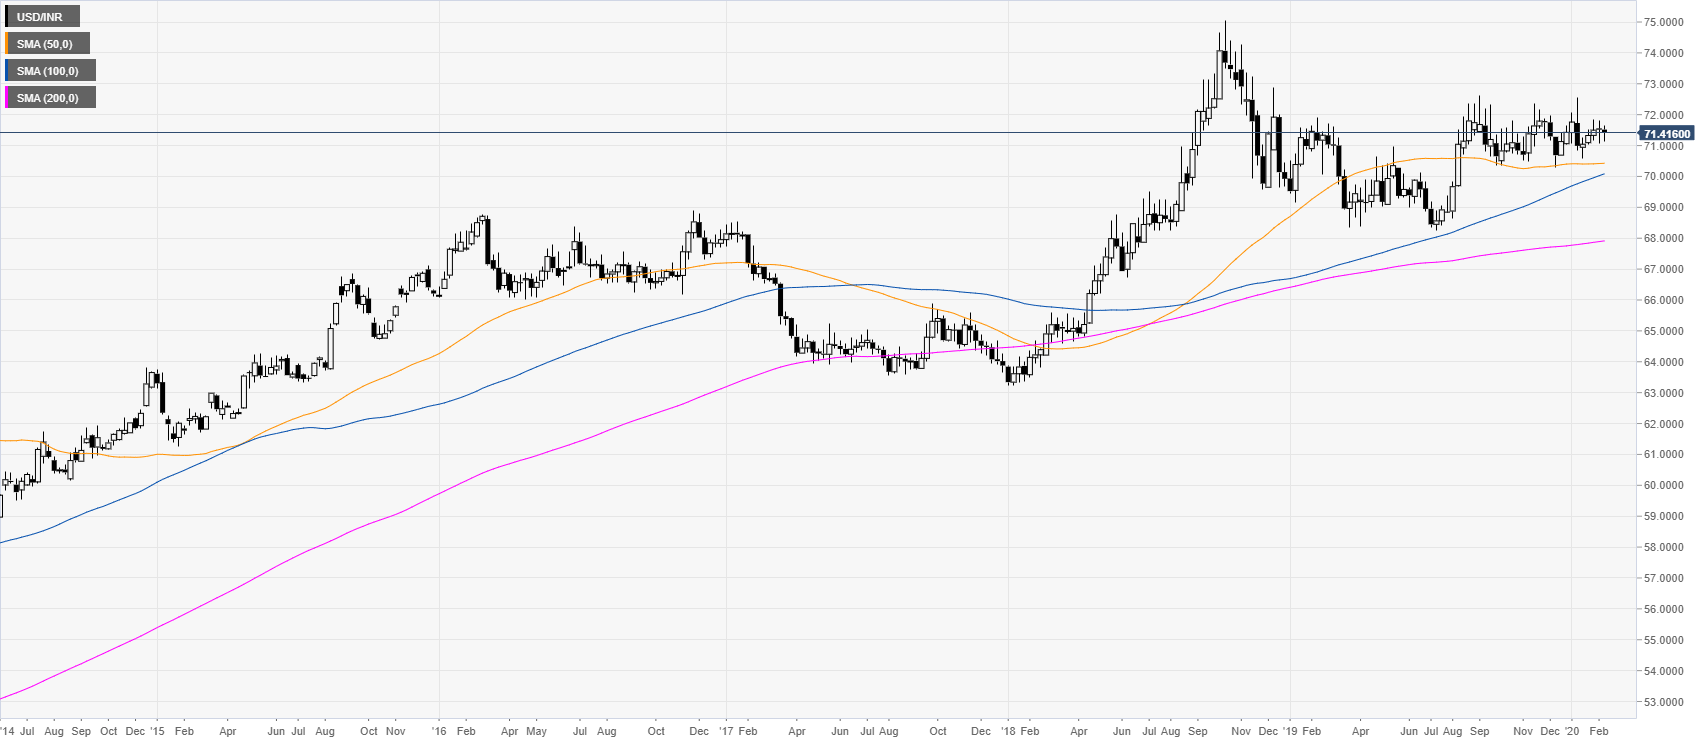
USD/INR weekly chart
Following the 2018 bull-run, USD/INR has been consolidating in a rectangle pattern. The spot is trading above the main weekly simple moving averages (SMAs), suggesting a bullish bias in the long term.

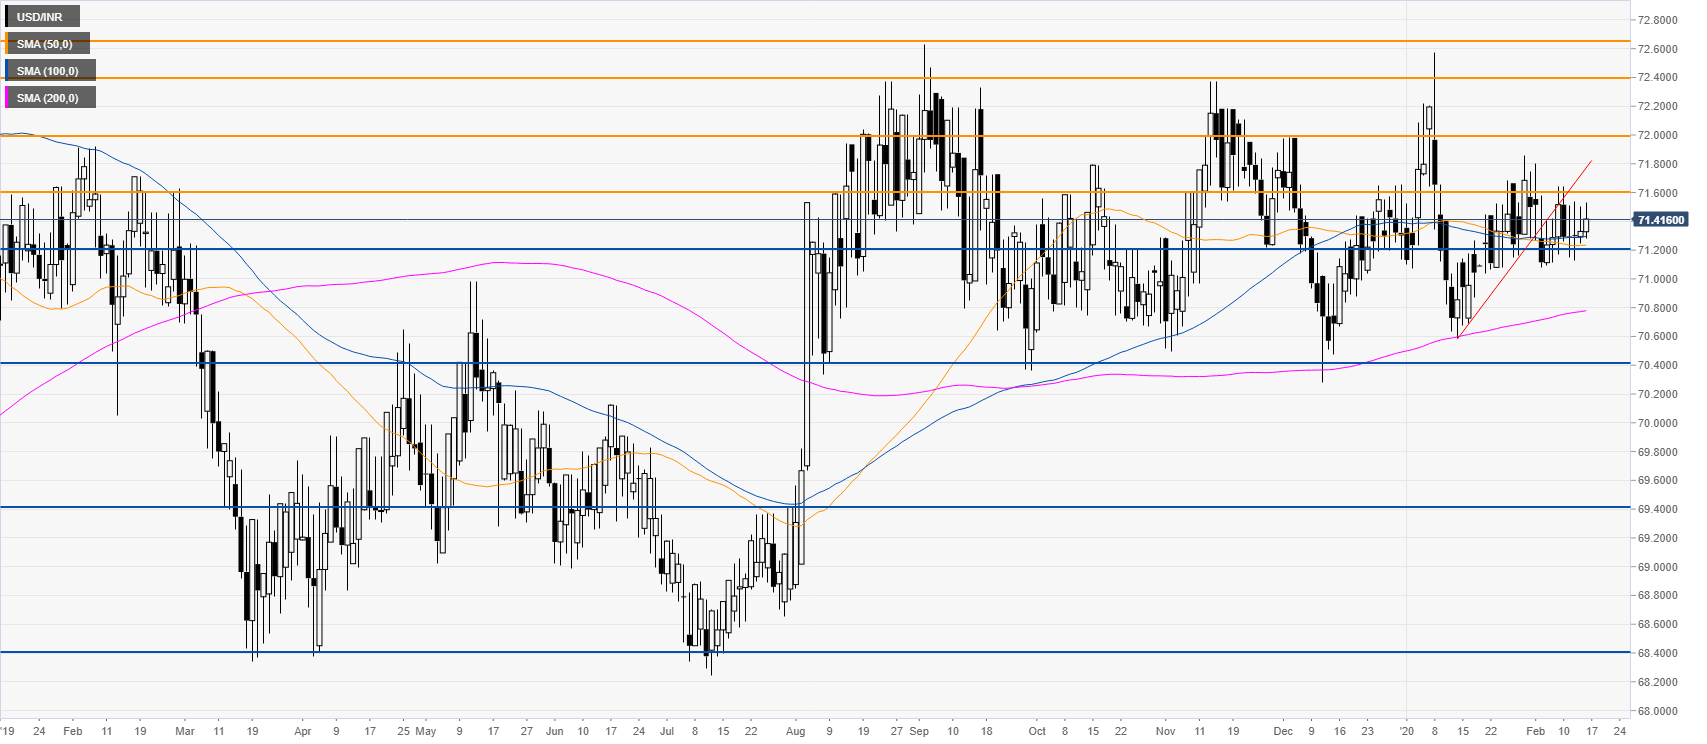
USD/INR daily chart
The quote broke below a bear flag formation and challenged the 71.20 support level to then retest the 71.60 resistance. However, USD/INR has entered a tight range while remaining vulnerable below the 71.60/72.00 resistance zone. However, a close above the 72.00 figure on a daily basis would likely invalidate the bearish scenario and yields further upside towards the 72.40 level.

Additional key levels
USD/INR
| Overview | |
|---|---|
| Today last price | 71.4128 |
| Today Daily Change | 0.0828 |
| Today Daily Change % | 0.12 |
| Today daily open | 71.33 |
| Trends | |
|---|---|
| Daily SMA20 | 71.2892 |
| Daily SMA50 | 71.1986 |
| Daily SMA100 | 71.2279 |
| Daily SMA200 | 70.6742 |
| Levels | |
|---|---|
| Previous Daily High | 71.505 |
| Previous Daily Low | 71.2455 |
| Previous Weekly High | 71.8045 |
| Previous Weekly Low | 71.077 |
| Previous Monthly High | 72.57 |
| Previous Monthly Low | 70.5875 |
| Daily Fibonacci 38.2% | 71.4059 |
| Daily Fibonacci 61.8% | 71.3446 |
| Daily Pivot Point S1 | 71.2154 |
| Daily Pivot Point S2 | 71.1007 |
| Daily Pivot Point S3 | 70.9559 |
| Daily Pivot Point R1 | 71.4749 |
| Daily Pivot Point R2 | 71.6197 |
| Daily Pivot Point R3 | 71.7344 |