OPEC January Production Data
by Ron PattersonSummary
- OPEC 14 crude oil production was down 509,000 barrels per day in January.
- OPEC announced a couple of months ago that Ecuador was leaving the cartel. However, it was still included in January's data.
- Iran appears to be leveling out at just over 2,000,000 barrels per day.
- Iraq is at 4.5 million barrels per day.
- Saudi Arabia's production was up 57,000 barrels per day in January, but that was after its December production had been revised down by 86,000 barrels per day.
All OPEC data below is from the February edition of the OPEC Monthly Oil Market Report. The data thousand barrels per day and is through January 2020. OPEC Monthly Oil Market Report
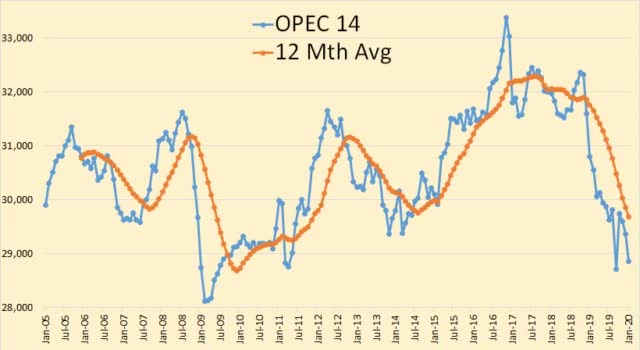
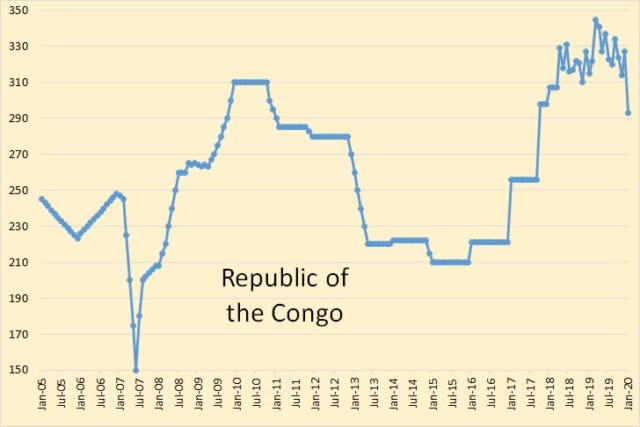
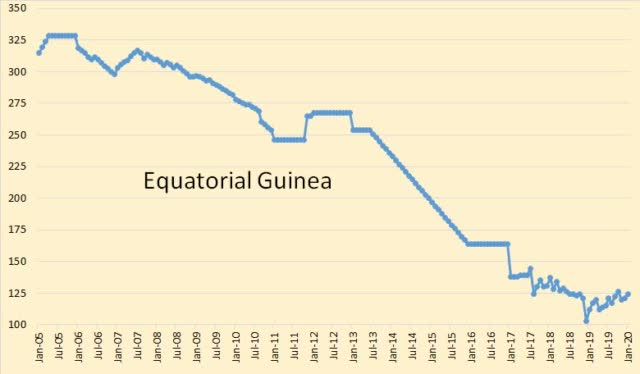
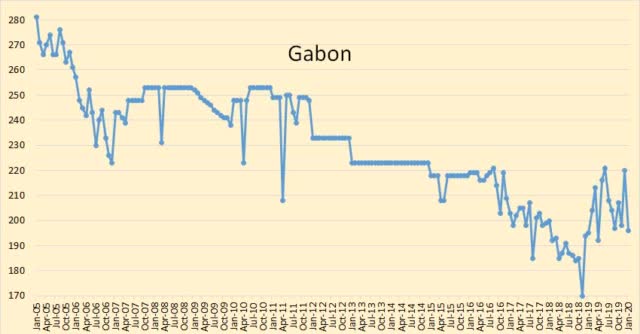
OPEC 14 crude oil production was down 509,000 barrels per day in January. And that was after December production was revised down 86,000 barrels per day.
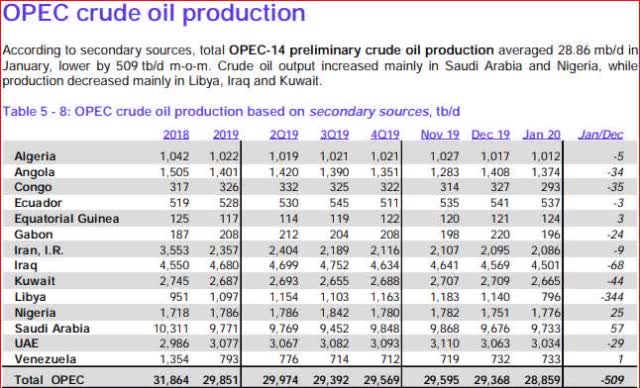
OPEC announced a couple of months ago that Ecuador was leaving the cartel. However, it was still included in January's data. I have no idea what's going on.
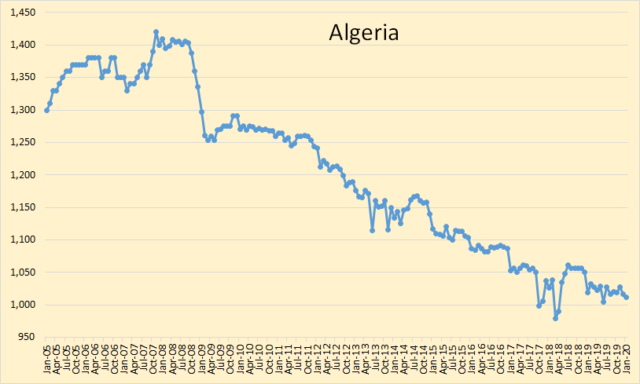
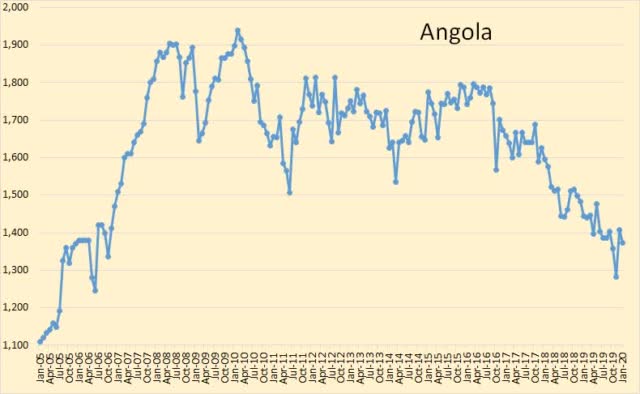
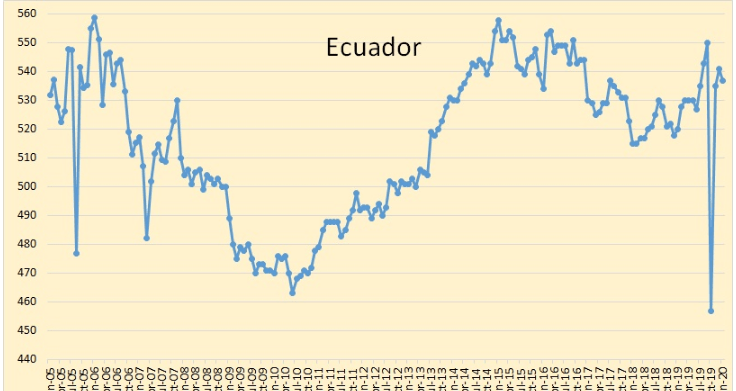
Ecuador appears to still be with OPEC even though it was announced that it was leaving this month.
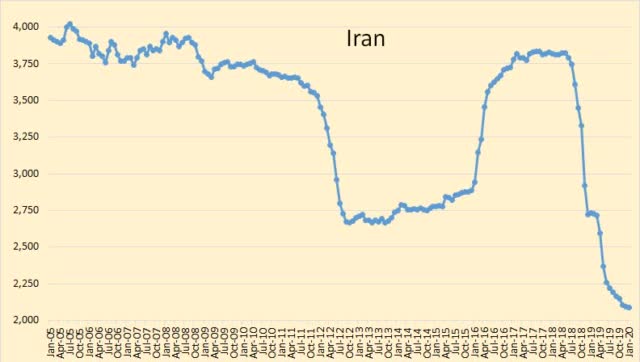
Iran appears to be leveling out at just over 2,000,000 barrels per day.
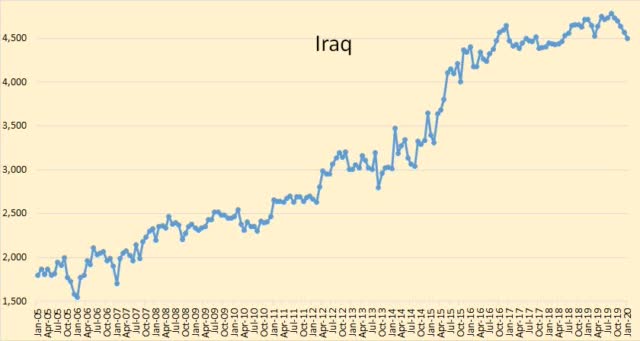
Iraq is at 4.5 million barrels per day. It has averaged 4.56 million barrels per day since the last quarter of 2016. It is my opinion that it is and has been producing flat out for many years.
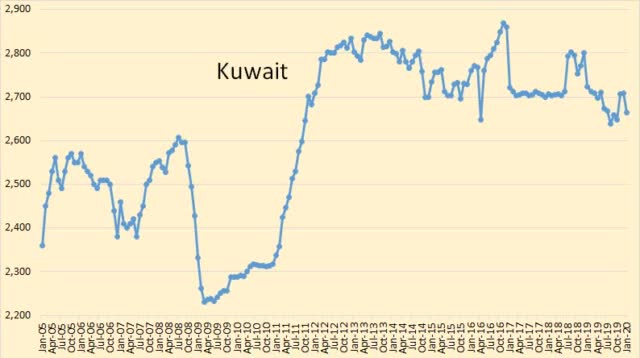
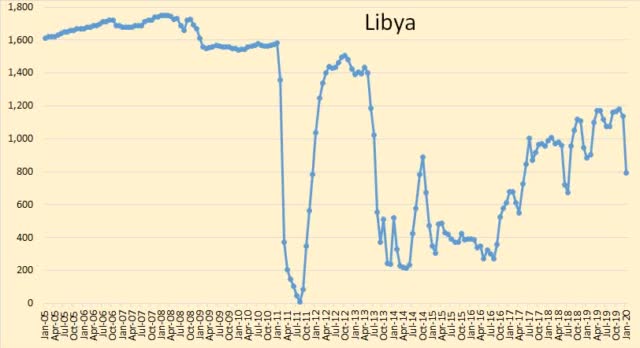
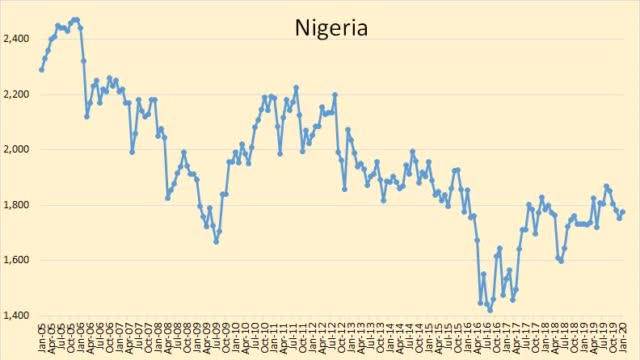
Libya's production for the last 10 days or so of January was only 200,000 barrels per day as the rebels blockaded its main port. The blockade is now in its fourth week, so we can expect Libyan production to drop even further in February.
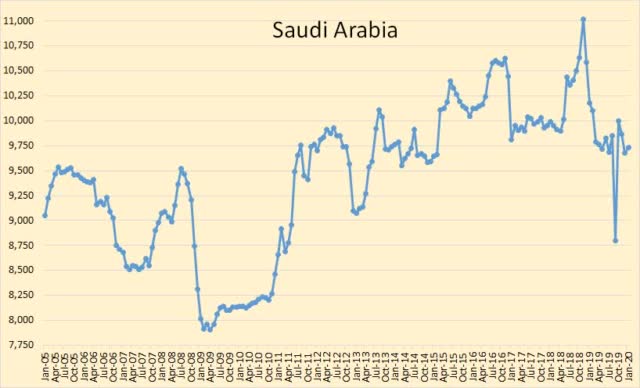
Saudi Arabia's production was up 57,000 barrels per day in January, but that was after its December production had been revised down by 86,000 barrels per day. It is now producing 578,000 barrels per day below its quota.
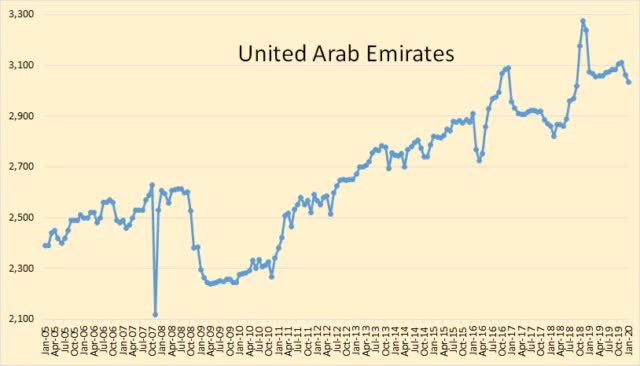
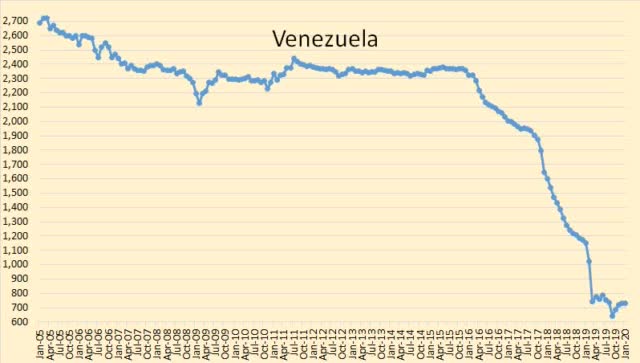
Venezuela's decline seems to have stopped. It is looking for international help to increase production. Its history of confiscating foreign equipment and paying them pennies on the dollar for it is hindering that effort. But Russia may be able to help as it plays by different rules.
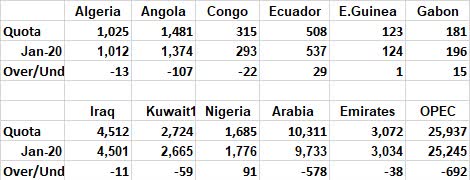
Iraq has finally met its quota. Angola wishes it could meet it. Libya, Iran, and Venezuela are exempt from quotas.
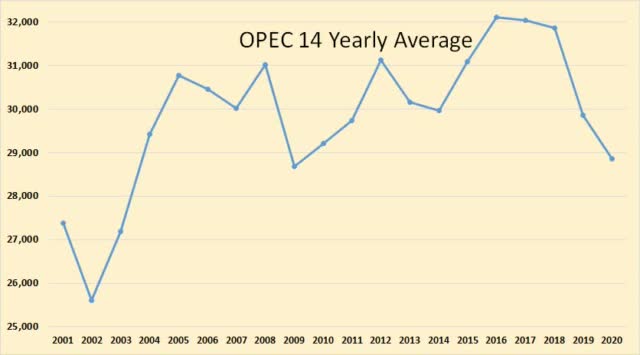
OPEC 14 Yearly average. The 2020 figure is only for one month. If that holds, it will be below its 2004 annual average.
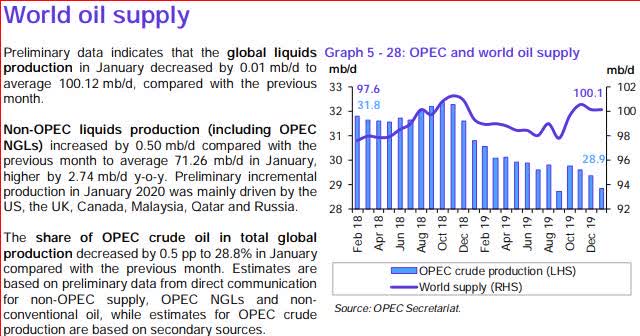
Its world oil supply graph is total liquids. It hardly resembles the C+C chart below. However, it still has the peak in late 2018.
The EIA has redesigned its International Energy Portal to streamline navigation, simplify data presentation, and implement responsive design use, or so it says. EIA World Crude Oil Data. It shows data for every producing nation, even the very small ones. It does not separate OPEC from Non-OPEC.
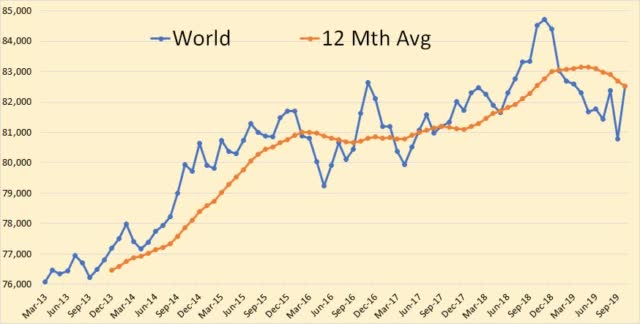
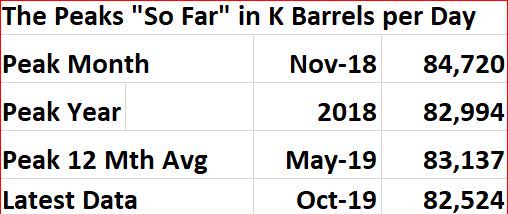
The Case For Peak Oil
When world oil production peaks depends on when the combined production of the world's top three producers peaks, the USA, Russia and Saudi Arabia. In fact, it could depend on when the USA peaks because shale production has been perhaps the primary reason the world has not already peaked.
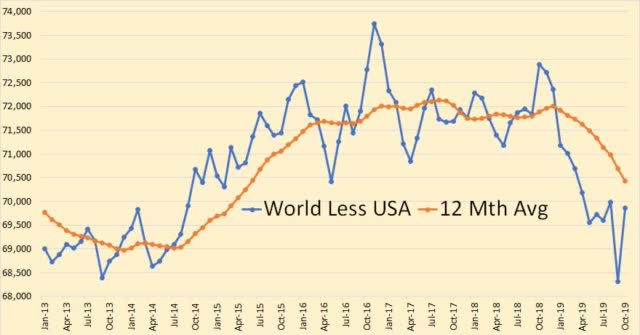
World C+C oil production, less USA production 12-month average, peaked so far in August 2017 at 72,134,000 barrels per day.
Okay, but what does World C+C production look like less all of the big three, USA, Russia and Saudi Arabia?
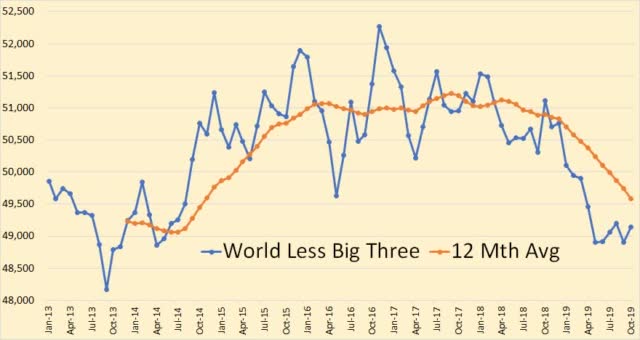
World less USA, Russia, and Saudi Arabia 12-month average peaked in September 2017 at 51,222,000 barrels per day and was down 400,000 bpd by December 2018 before the OPEC cuts. Obviously every nation other than the big three has not peaked, but cumulatively they have peaked.
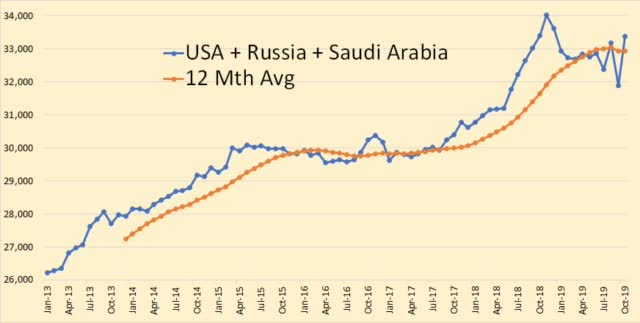
Here is the production data of the big three through October 2019.
Let's deal with all three, first Russia.
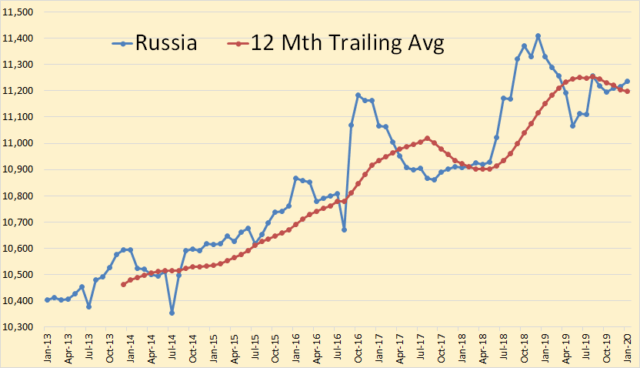
Russian production was up 20,000 bpd in January. It has stated that it hopes to hold at this level through 2023. However, it is obviously lobbying for lower taxes on profits. The Russian Minister of Energy has stated:
If current production trends continue, and if Russia doesn't do anything to further stimulate oil exploration and new field development, after 2021, production may start to fall and reach just 310 million tons by 2035, that is, Russia's oil production could drop by 44 percent by then, Novak said back then.
Almost 60% of current Russian oil production comes from its aging super-giants in Western Siberia. From Statista:
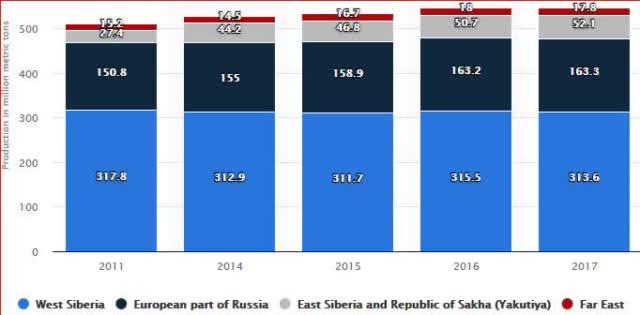
But how has Russia been able to keep its old Western Siberian fields from decline? We get a hint from this Russian Analyst back in 2009. Alex Burgansky: Russian Oil and Gas Industry Surprises Analysts:
There are plenty of projects in Russia, both, new projects and existing brownfield projects. Russia is a very mature producer. If you exclude all the drilling activity taking place every year, then Russian organic decline in production is close to 19%. To compensate for that organic decline, Russia drills somewhere between 5,000 and 6,000 wells every year.
Many of those wells, perhaps most, are what they refer to as "existing brownfield projects". That is infill drilling with horizontal wells in their old Western Siberia giants. They are in decline but all that infill drilling has dramatically slowed their decline rate.
In fact: Russia makes its oil reserves work harder as output declines
Such technological solutions as increased share of horizontal drilling, multistage hydraulic fracturing and multi-hole drilling have allowed Rosneft, Russia's top crude producer, to slow the decline at Samotlor to 1 percent last year. The oilfield dates back to 1965 and is one of the largest in the world.
Last year, in the above article, was 2018. It has gotten the decline rate for its very old super-giant down to 1% per year. Of course, the depletion rate has not declined at all.
Below: Russia through January 2020 and projected through December 2021
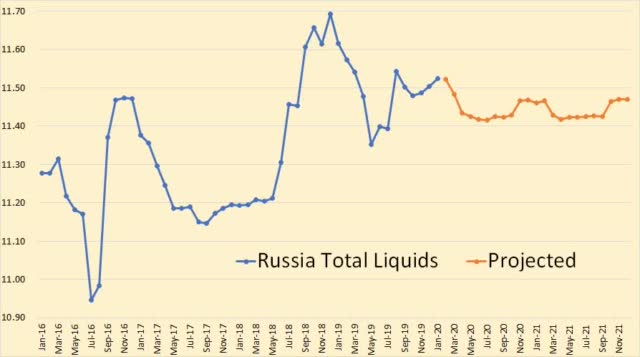
Russia total liquids according to the EIA Short Term Energy Outlook. Russia has much as having said it has peaked and it seems the EIA agrees.
I will not dwell on USA decline because we cover that almost every day here on Peak Oil Barrel. But most of us agree the peak could very well be this year, or in two or three years at the latest. At any rate, it appears that the dramatic growth in USA oil production is a thing of the past. The next few years will very likely see a plateau at best and an almost sure decline soon.
Then there is Saudi Arabia. I posted the Saudi production chart up top and will not re-post it here. However, I will point out a few very obvious things concerning Saudi Arabia and especially the largest field ever discovered, Ghawar.
From Bloomberg in April 2019: The Biggest Saudi Oil Field Is Fading Faster Than Anyone Guessed:
When Saudi Aramco on Monday published its first-ever profit figures since its nationalization nearly 40 years ago, it also lifted the veil of secrecy around its mega oil fields. The company's bond prospectus revealed that Ghawar is able to pump a maximum of 3.8 million barrels a day - well below the more than 5 million that had become conventional wisdom in the market.
Euan Mearns posted in The Oil Drum: Europe in April 2007, the following graph and data.
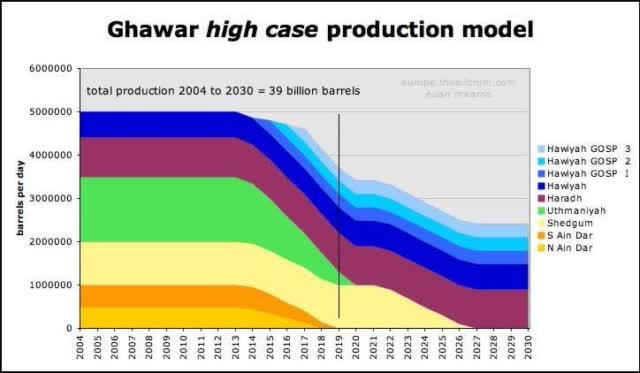
Notice where the 2019 line dissects Euan's high case prediction, at exactly 3.8 million barrels per day. Yes, he had a base case that was a bit more pessimistic.

2002 was the last year any reserve figures came out of Saudi Arabia. Euan took those figures and projected them to 2006. What would they look like in 2020? Note: That data was not published by ARAMCO but by the Society Of Petroleum Engineers. Apparently they got their data from engineers who worked for ARAMCO before their total data shutdown. I do not have access to that data but apparently Euan did.
I am convinced that all the recent decline in Saudi production is not deliberate cuts. Some maybe, but definitely not all. It had a reason for issuing that ARAMCO IPO.
What is meant by the term "natural decline rate?
I, and others, have used the term "natural decline rate". Exactly what is "a natural decline rate"? And what did ARAMCO mean when it used the term?
Without "maintain potential" drilling to make up for production, Saudi oil fields would have a natural decline rate of a hypothetical 8%. As Saudi Aramco has an extensive drilling program with a budget running in the billions of dollars, this decline is mitigated to a number close to 2%.
For starters, it depends on the size of the field and how long that field has been in production. A very small field will reach peak production and start to decline almost immediately. Even a giant field like Prudhoe Bay or Cantrell would begin to decline within a few years after peaking. But a supergiant field may produce for decades before production begins to decline. However, once a field begins to decline, then the decline rate should match the depletion rate. That would be the natural decline rate.
But if a country notices, after many years of level production, that their supergiant fields have begun to decline, that would likely be because the rising water table is rising to a higher level on their vertical wells. That country could counter that problem by shutting off its vertical wells and drilling new horizontal wells that pull only from the very top of the reservoir. They could then dramatically reduce their decline rate. But that would not help their depletion rate a damn bit.
If the depletion rate is far greater than the decline rate, then what must happen is not a theory, it is a hard-cold mathematical fact. The decline rate must, at some point, dramatically increase. The decline rate would look very much like a Seneca Cliff.
Note: A Seneca Cliff decline is experienced by fields, not countries. It is extremely unlikely that any very large producing country would experience a Seneca Cliff type decline.
What is happening right now in Ain Dar, Shedgum, and Uthmaniyah can accurately be called a Seneca Cliff. And since Russia has gotten Samotlor's decline rate down to 1% by creaming the top of the reservoir, we can expect a Seneca Cliff there in the near future, if it has not already begun.
Saudi Arabia likely already in decline, Russia likely at a peak plateau, the USA very near its peak, and the rest of the world is, cumulatively, post-peak. Is the world at or near peak oil? Or, can the USA continue to increase production enough to overcome the decline in the rest of the world? What would you conclude?
Editor's Note: The summary bullets for this article were chosen by Seeking Alpha editors.