4 Things Royal Dutch Shell Investors Need To Know In 2020
by Brad ThomasSummary
- Royal Dutch Shell is an above-average, quality high-yield stock with a trustworthy dividend.
- Royal Dutch Shell offers above-average growth potential courtesy of a smart strategic focus on LNG.
- The valuation is good with solid long-term income and total return potential.
This article was coproduced with Dividend Sensei and edited by Brad Thomas.
I'm becoming increasingly attracted to stocks that offer attractive compelling dividends and solid price appreciation potential. In today’s low-yield environment, I'm constantly looking to sectors outside my REIT wheelhouse that offer promising risk/reward opportunity. One such company that I am considering myself is Royal Dutch Shell (RDS.A)(RDS.B).
Royal Dutch Shell Vs. Exxon Since 1988
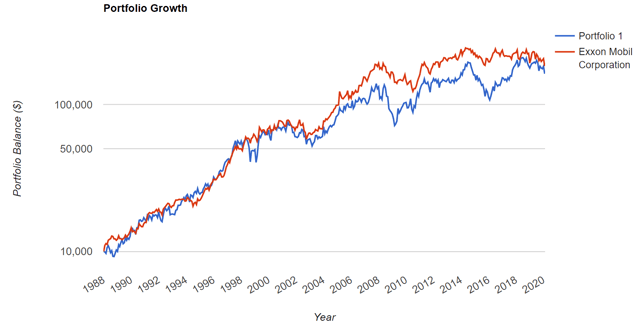

(Source: Portfolio Visualizer) portfolio 1 = RDS
Therefore, that’s exactly what we’ve put together.
For starters, compared to the 10/11-quality SWAN Exxon Mobil (XOM) – our top integrated oil recommendation of 2020 – Shell has done an admirable job of generating safe and rising income.
Now, it must be said that it hasn’t hiked its dividend every year as we’d prefer.
Also, Shell's lower-quality (8/11) rating did cause it to lag Exxon a bit, causing 33% more annual volatility. Thus, since 1988, its reward/risk ratio (excess total returns divided by negative volatility = Sortino Ratio) has been 20% lower.
Yet, for a stock owned almost entirely for its income, Shell is a fine holding and a good buy for 2020, as long as you understand its risk profile and high uncertainty surrounding its valuation and long-term return potential.
So let's look at the four things investors need to know about Shell in 2020 and beyond.
1: An Above-Average Quality High-Yield Stock With a Trustworthy Dividend
Unlike its peers, Exxon and Chevron Corp. (CVX) – which are dividend aristocrats – Shell's claim to fame isn't steady dividend growth in all industry/economic conditions. Rather, it’s beloved by income investors for the dividend it hasn't been cut (when adjusted for currency fluctuations) since WWII.
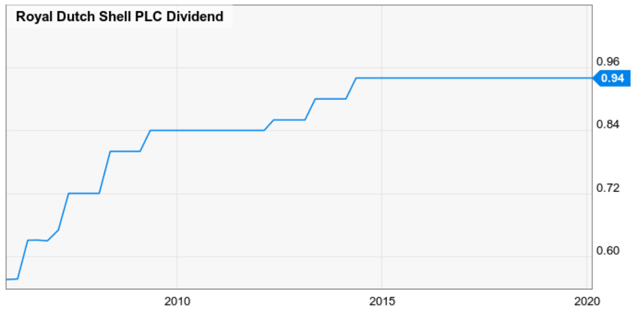
(Source: Ycharts)
Admittedly, during the 2016 oil crash, it did pay the dividend partially in stock. However, it's since cut operating costs 20% compared to pre-oil crash levels in 2014.
As such, its current cash dividend is likely safe over the long term, an assessment Morningstar concurs with.
With the restoration of its cash dividend, Shell has demonstrated it has taken the necessary steps to remain competitive in a world of $60/barrel oil... Shell plans to avoid the mistakes of the past, when rising commodity prices resulted in ever-increasing capital budgets, by keeping yearly capital spending between $24 billion and $29 billion through 2020, a 40% reduction from the nearly $50 billion it spent in 2014. The sharp decrease should improve capital efficiency, but should not completely sacrifice growth. " (Emphasis added.)
It’s true that modest hikes can be followed by years of no growth at all. But Shell manages to offer a generous 7% yield with above-average safety relative to most corporations.
Why Shell Has 4/5 Above-Average Dividend Safety
| Metric | Shell | Safe Level for Industry | Industry Median |
| FCF Payout Ratio (2020 Consensus) | 57% | Under 100% over time | NA |
| FCF trend | positive in the last 16/20 years, 4.4% CAGR growth over 20 years | stable and growing across industry/economic cycles | NA |
| Dividend Track Record | no cuts since WWII, 4.9% CAGR growth over 20 years | stable and growing across industry/economic cycles | NA |
| Debt/EBITDA | 1.8 | 1.5 or less | 2.8 |
| Interest Coverage | 2.6 | 10 or higher | 5.0 |
| Debt/Capital | 28% | 30% or less | 31% |
| S&P Credit Rating | AA- | BBB- or higher | NA |
(Source: Gurufocus, F.A.S.T Graphs, FactSet Research, S&P)
Shell's debt is on the high side of safe for this industry – courtesy of its $70 billion acquisition of BG Group, the world's largest liquid natural gas shipper, in 2015. But $10 billion in divestments between 2019 and 2020 should bring debt/capital down to 25% by the end of the year.
Another $20 billion in non-core asset sales are slated for 2021-2025. That should further help Shell improve production profitability and maintain a safe balance sheet.
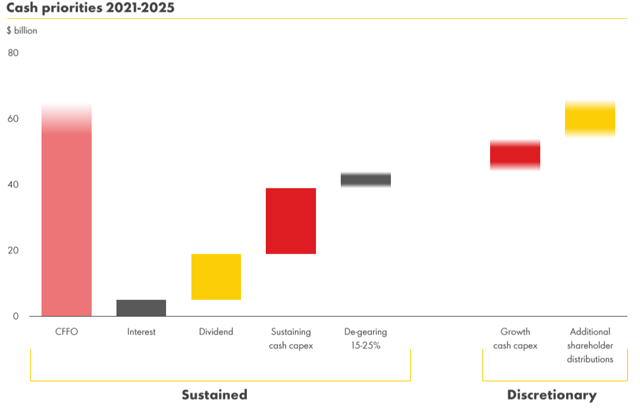
(Source: investor presentation)
By 2025, the company estimates that its debt/capital will have fallen to about 20% – courtesy of more than $60 billion in operating cash flow that's about 30% higher than in 2019.
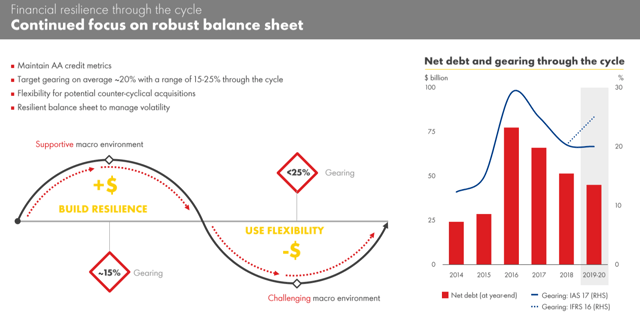
(Source: investor presentation)
Shell actually plans for a mid-range 20% debt/capital across the industry cycle. During good times specifically, it wants to take that down to 15% to be ready for when energy prices tank.
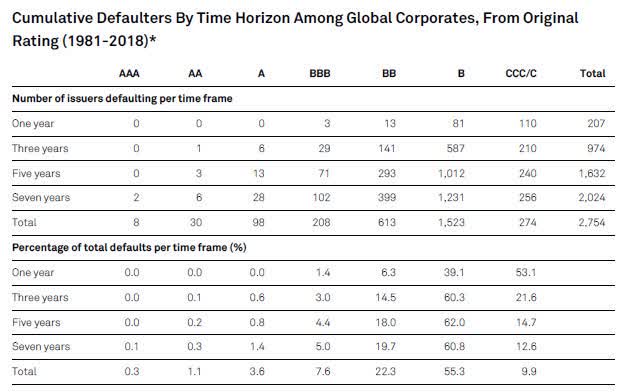
(Source: S&P)
As it is right now, S&P considers Shell's balance sheet to be AA- worthy. That implies about a 2% probability of a bond default during the next 30 years, which seems pretty good to us.
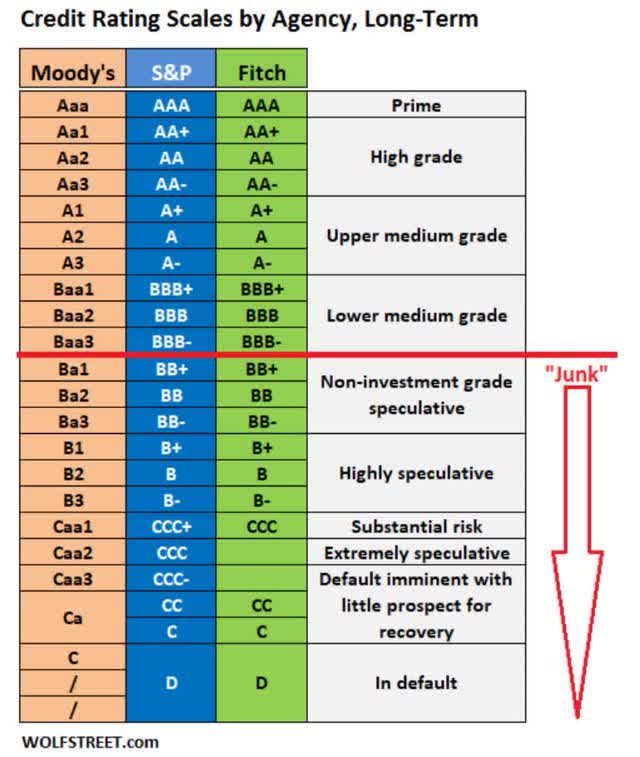
Meanwhile, Moody's last completed evaluation on Jan. 23 rated it Aa2 with a stable outlook. That's the equivalent of an S&P AA rating.
Here's Sven Reinke, senior vice president of Moody's Corporate Finance Group, explaining why:
Royal Dutch Shell's (Shell) Aa2 ratings reflect the company's strong business profile, with its large and well-diversified production and reserve base as well as its unique position as one of the world's largest producers and marketers of LNG. The ratings also incorporate Shell's integrated business model with profitable downstream operations and the improved financial profile following a recovery in the company's funds from operations (FFO), disciplined capital spending and a reduction in debt level... Moody's conservatively expects that Shell will generate around $48 billion in FFO annually in 2019-20, compared to $50 billion FFO in 2018. While the rating agency expects FCF to be largely balanced over 2019-20, the forecasted $20 billion share buyback volume will not be fully compensated by $10 billion of disposal proceeds over the next two years, thereby leading to an increase of adjusted net debt to around $90 billion in 2020 from $79 billion in 2018. Nevertheless, Shell should remain solidly positioned in the Aa2 rating category... The stable outlook is underpinned by the company's stated commitment to give priority to debt reduction despite the cancellation of the scrip dividend option and the announcement of a $25 billion share buyback programme after its reported gearing ratio (net debt/capital) improved to around 20% from the peak of around 30% in 2016. We will monitor the timing of the announced $25 billion share buyback programme versus the company's stated target to lower its reported gearing to below 20% in 2020. Shell's more proactive approach than its rivals toward gradually changing its energy product mix, by developing and growing its New Energies business, will become more relevant for its credit quality in the years to come... A strong low-carbon energy business could help Shell to offset the potential decline of earning power and cash flow generation of its traditional oil and gas operations after 2040, when most projections expect a material shift towards low-carbon energy sources and away from fossil fuels. " - Moody's (emphasis added)
As you can see, Moody's considers Shell to be a reasonably conservative company. That’s from the perspective of bond investors who only care about getting their principal back along with modest interest payments.
It also likes how Shell is being relatively proactive in diversifying into alternative energy. That hopefully sets the stage for safe dividends long after 2040, when most analysts/economists expect demand for fossil fuels to grow significantly.
Specifically, Shell plans to invest $3 billion through 2025 into electric utilities. Compared to other oil majors, that's a large amount. Even so, it isn't going to lead to needle-moving diversification.
As for Shell's average interest cost, it’s at 4.8%, which you might think is high for an AA- rated company.
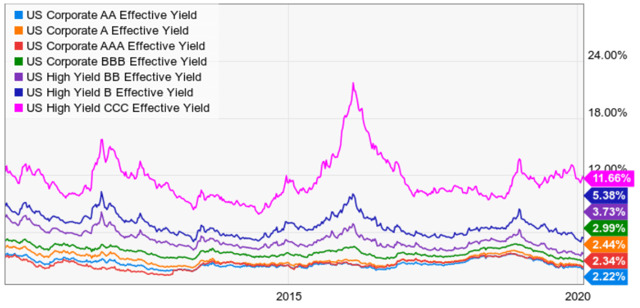
(Source: Ycharts)
Indeed, expect that bond yields fluctuate over time, influenced by such things as closing the big BG Group bond round back in 2015. In the future, much lower yields on refinanced debt should allow RDS to significantly strengthen its balance sheet.
The result? Lower effective interest rates and cost of capital.
In short, if all you care about is a generous and safe dividend that can stand up to volatile oil prices and even recessions, Shell is one of the better choices in front of you.
Not to mention one with an above-average growth potential relative to some of its peers.
2: Above-Average Growth Potential Courtesy of a Smart Strategic Focus on LNG
It's important to realize that there’s always high-growth uncertainty with integrated oil companies.
| Company | FactSet Long-Term Growth Consensus | Reuters 5-Year Growth Consensus | Ycharts Long-Term Growth Consensus | Average Growth Consensus |
| XOM | 13.4% | 2.2% | 7.0% | 7.5% |
| CVX | 4.9% | 9.6% | 7.1% | 7.2% |
| RDS | 8.5% | NA | 6.5% | 7.5% |
| BP | 2.5% | NA | 9.5% | 6.0% |
| TOT | 8.2% | 0.5% | 9.5% | 6.1% |
| EQNR | NA | 8.1% | -4.2% | 2.0% |
| Average | 7.5% | 5.1% | 5.9% | 6.0% |
(Sources: F.A.S.T Graphs, FactSet Research, Reuters', Ycharts)
However, as far as analyst consensus is concerned, RDS, CVX and XOM are best positioned to generate moderate growth over time.
Here's RDS' medium-term growth outlook.
Royal Dutch Shell Growth Matrix
| Metric | 2020 Growth Consensus | 2021 Growth Consensus | 2022 Growth Consensus |
| Dividend (YOY) | 0% | 2% | 2% |
| Earnings | 20% | 10% | 9% |
| Operating Cash Flow | 22% | 2% | 7% |
| EBITDA | 26% | 2% | 2% |
| EBIT | 68% | 5% | 8% |
(Source: F.A.S.T Graphs, FactSet Research)
According to the 16 analysts covering it, the company should report strong growth this year. Fundamentals are expected to increase between 20% and 68%, depending on the metric.
Even the dividend should grow near its historical 1% rate beginning next year once deleveraging is complete.
Of course, it's important to remember that forecasts for non-midstream energy stocks can be highly volatile. You can see this in Shell’s long-term growth consensus from YCharts.
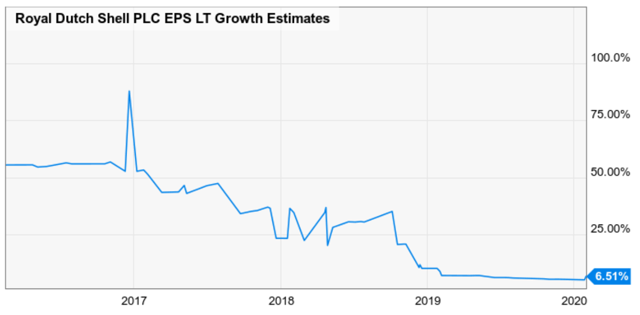
(Source: YCharts)
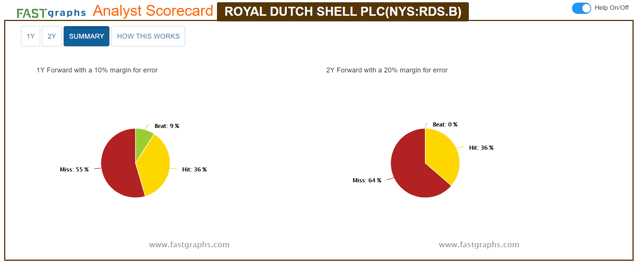
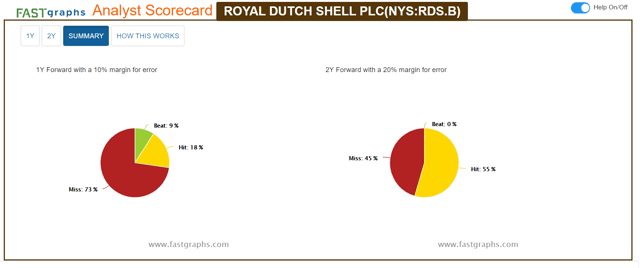
So here’s how often it met, beat, and missed its various fundamental forecasts over the last 20 years. (Twelve and 24-month success rates include a reasonable 10% and 20% margin of error, respectively.)
EPS Analyst Scorecard
Operating Cash Flow Analyst Scorecard
EBITDA Analyst Scorecard
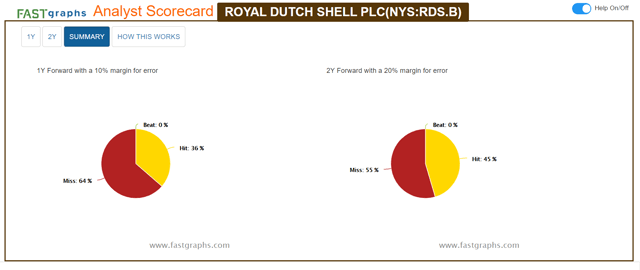
Here’s the point. When dealing with big oil companies, earnings and cash flow are often entirely at the mercy of volatile commodity prices. Therefore, there always will be a high amount of valuation/growth/return potential uncertainty.
For example, Shell's latest earnings disappointed and ongoing low oil prices will apparently reduce its pace of buybacks. But here's Morningstar's Allen Good explaining why this is not a concern for the thesis (emphasis added).
Its next repurchase tranche would total $1 billion compared with $2.75 billion previously. At the updated rate and with nearly $15 billion in repurchases complete, Shell will not fulfill its $25 billion target by year-end 2020. Given the slowdown largely related to commodity prices and not to operational execution, our confidence in Shell’s long-term targets remain intact and our FVE and narrow-moat rating is unchanged."
I also should note that my fair value estimate of $66 is more conservative than Morningstar's $78.
We are maintaining our fair value estimate of $78 per share, which corresponds to a forward enterprise value/EBITDA (earnings before interest, taxes, depreciation, and amortization) multiple of 6.5 times our 2019 EBITDA forecast of $55.6 billion."
(Emphasis added.)
More on this in the valuation section. But the main reason I'm valuing RDS lower is because I'm using the 20-year average EBITDA multiple of 4.6. Morningstar, meanwhile, is working with a more bullish 6.5, even though Shell rarely trades at that, except when overvalued.
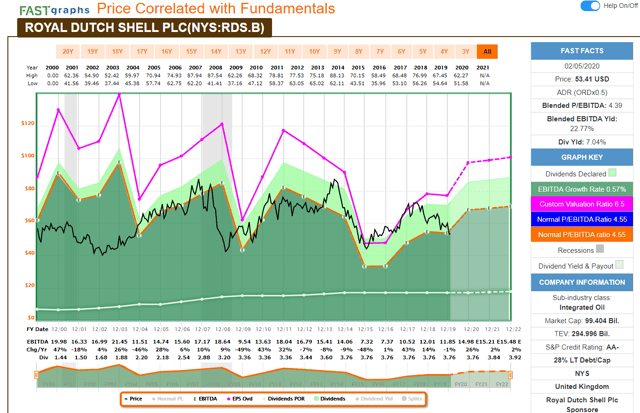
(Source: F.A.S.T Graphs, FactSet Research) - purple line = Morningstar fair value multiple
Even during periods of 11% CAGR (compound annual growth rate) growth, RDS has only traded at six times EBITDA. And most of the time, it’s between 4.5 and 5.5. Due to the cyclical nature of this company's earnings and cash flow, I consider a more conservative estimate to be prudent.
What are the catalysts for delivering the 6%-9% long-term cash flow growth analysts expect?
Shell plans to spend $30 billion on capital expenditures from 2021 to 2025, matching Exxon for the most growth spending of any oil major. This will be focused on low breakeven cost projects such as offshore Brazil and the Gulf of Mexico, where oil can be profitably produced at Brent prices of as little as $45.
At $65 global oil prices, RDS estimates it can generate $25 billion in annual free cash flow. Compared to $15.2 billion in dividend costs, that represents a long-term free cash flow payout ratio of 61%.
Shell recently told analysts that, if oil prices pick up, its earlier free cash flow guidance could be conservative. Here's how CEO Ben Van Beurden put it at the Q4 conference call (emphasis added):
The current cash flows could bring us to $28 billion to $33 billion in organic free cash flow by the end of this year if we see an improvement in macro conditions to our reference price conditions.
If oil prices cooperate, $30 billion in free cash flow would represent a 50% FCF payout ratio, one of the best of any oil company right now.
However, keep in mind that the average global price in 2019 was $64, and Brent currently sits at $55. So investors shouldn't necessarily expect RDS to beat expectations this year, as management is hinting is possible.
As it was, that $64 price tag translated into $47 billion in operating cash flow and $20 billion into organic free cash flow, representing a 75% FCF payout ratio. Which is still excellent compared to its peers.
FCF is of paramount importance to income investors, it’s true. But profitability is still a good proxy for management/business quality, something all investors need to pay attention to.
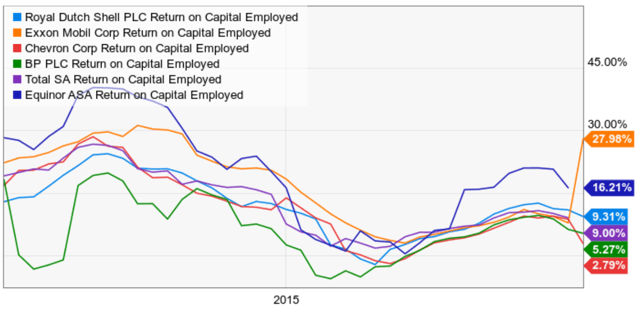
(Source: Ycharts)
Return on capital employed (ROCE) is the industry version of return on invested capital. It's defined as pre-tax profit (EBIT)/ divided by capital employed (net assets), and it’s a useful quality proxy for comparing oil companies across time.
In the short term, ROCE is highly volatile, as you can see. RDS' goal is to get back to 10%, which it’s nearly done since the dark days of the 2016 oil crash.
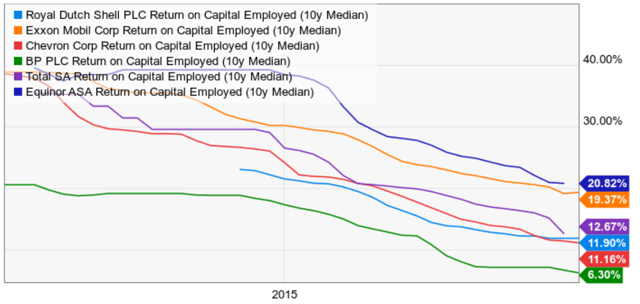
(Source: Ycharts)
That’s slightly less than its 10-year median. And it’s middle of the road for oil majors, where Exxon stands out as one of the best-managed and best-run oil companies you can own. For now.
By 2025, RDS expects to achieve 12% or greater ROCE, which is slightly better than its 10-year median.
Shell's cost-cutting so far has been impressive, with analysts expecting cost per barrel to fall about 60% in 2018-2022 relative to 2010-2014. That pre-crash period saw oil trading at $100 consistently, which isn't likely to be repeated given America's shale-driven status.
Regardless, Shell continues to seek out ways of squeezing out costs anywhere it can find them. Its CEO explained:
By systematically applying capital efficiency improvements, we have been able to structurally and to sustainably reduce costs across our project portfolio. Competitive scoping, systems engineering, efficient execution, recurring value in the supply chain, all these things have been crucial to our achievements.
How disciplined is RDS being with shareholder capital? How about this (emphasis added):
Our average forward-looking breakeven price for projects that we took a final investment decision on in 2019 was under $30 per barrel. And this focus on efficiency will continue. It will continue to be a feature of what we do in each of our strategic themes, and we will continue to build resilience and returns on the back of it."
Shell isn't just planning for a world of $60 long-term crude. It's making investment decisions based on being able to generate decent returns even if oil were $30.
I consider RDS management to be competent and trustworthy, though merely above average instead of excellent like XOM's or Chevron's. Morningstar agrees with me, with Allen Good explaining (emphasis added):
Management’s plan to cut costs, reduce spending, and divest underperforming assets is sound, but execution is key. And Shell, like many major integrated firms, has stumbled in the past. If management delivers, shareholders will be rewarded with a meaningful improvement in returns on capital during the next five years, although they will likely remain below those of its higher-quality peers because of past capital-allocation mistakes... Early indications suggest the firm is on track, however, with the completion of the asset divestiture program, reduction in debt and the restoration of the cash dividend a signal of confidence that it will achieve its future cash flow and return targets. Despite its missteps in the past, we think Shell is on the right track now and award it a Standard stewardship rating.
But those are how Shell plans to become a leaner, meaner, and more profitable company. It’s also why investors can sleep well with Ben van Beurden at the helm.
How is it actually going to grow at the impressive rates analysts expect? More importantly, how is RDS planning on maintaining a safe dividend that analysts expect to begin growing at 2% starting in 2021?
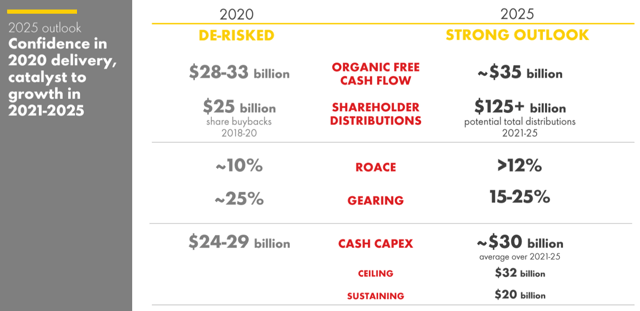
(Source: investor presentation)
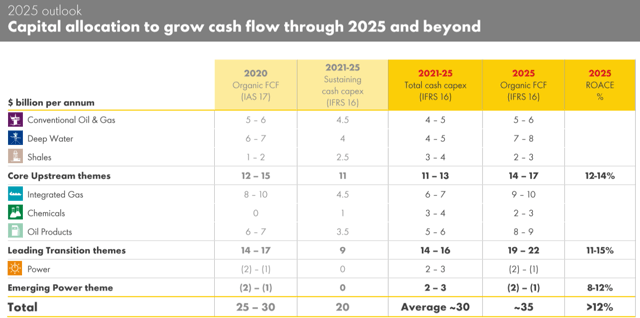
Shell's plan to get ROCE to 12% or higher and generate about $35 billion FCF involves about $150 billion in growth spending from 2021 to 2025.
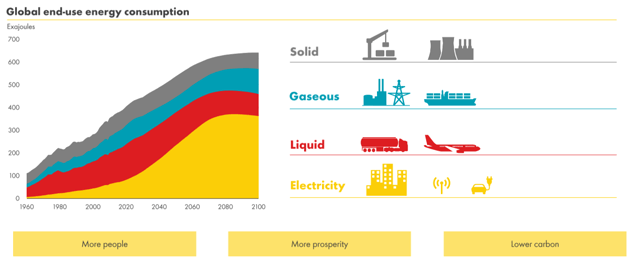
(Source: investor presentation)
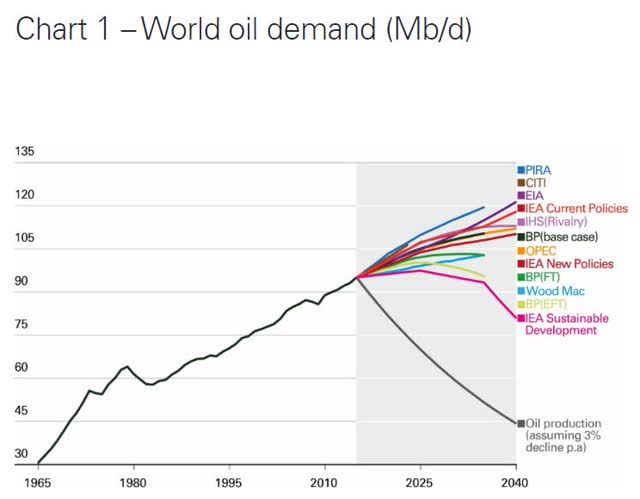
Shell's internal energy model – not to mention Moody’s and most analysts – says that demand for oil and gas should continue growing modestly through 2040 and remain relatively stable through 2100.
Natural gas as a cleaner source of baseload power is the main reason the age of fossil fuels isn't going to end nearly as quickly as many environmentalists would like.

(Source: Quote Fancy)
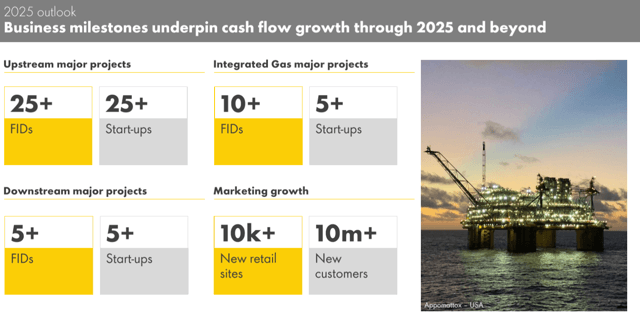
Shell plans to make final investment decisions on at least 40 large scale projects as well as 40 smaller ones through 2025.
(Source: investor presentation)
Thirty-five of those major projects are focused on oil and gas production growth.
(Source: BP)
No matter what long-term oil demand growth model you look at, one thing is clear…
Even if all the world's countries were to achieve their Paris Accords targets (which, so far, none are even trying at), even just 3% a decline rates would leave the world's supply of oil far below demand. OPEC estimates global decline rates at 6%, which explains why oil majors like RDS and XOM are so bullish on new growth spending today.
(Source: investor presentation)
Shell's spending is slated to be 78% focused on oil and gas projects it believes it can earn 12%-14% ROCE on – part of its drive to increase profitability.
(Source: investor presentation)
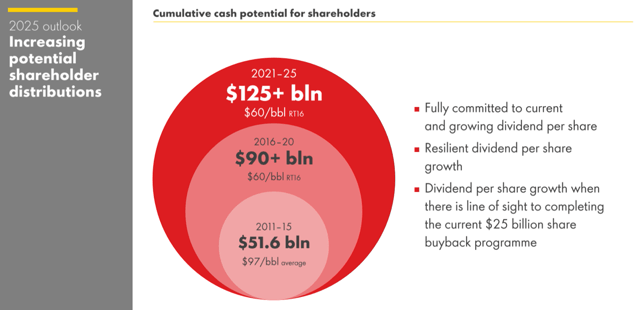
Management expects to return more than $125 billion to shareholders via dividends and buybacks from 2021 to 2025. And dividend growth is expected to resume once the $25 billion repurchase program is complete, with $15 billion already done.
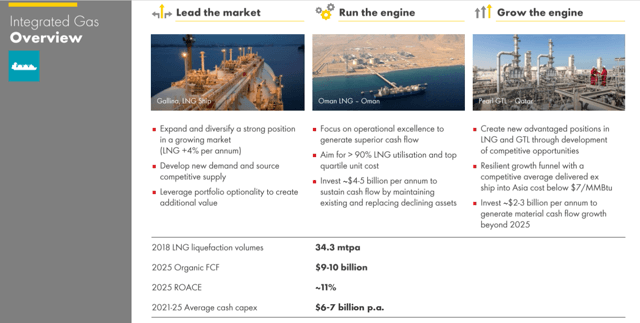
Shell is the most gas-ambitious oil major, with plans to grow LNG production 4% annually through 2025. By that time, it expects that about $10 billion, or 30% of FCF, will come from that part of its business.
(Source: investor presentation)
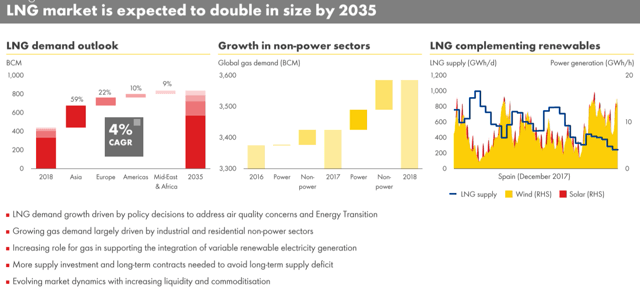
Why is Shell so bullish on LNG? How about how:
- It’s 50% cleaner than coal
- China LNG demand is expected to grow 6% CAGR through 2025.
(Source: investor presentation)
By 2035, LNG demand is expected to double, courtesy of 4% annual growth, about four times faster than oil. India, China, and emerging markets overall are the key growth catalyst here.
(Source: investor presentation)
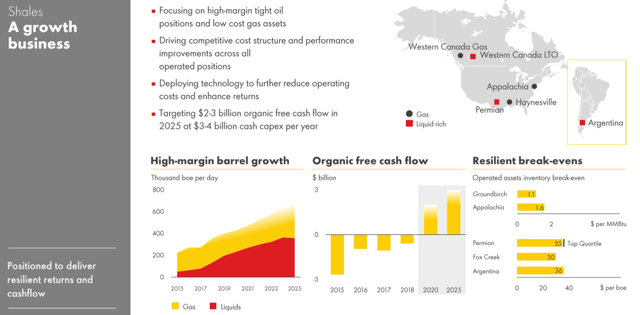
But just like all major oil companies, Shell plans to invest heavily in shale in the U.S., Canada, and Argentina. Its estimated breakeven cost in the Permian is $35. And in Canada, Shell projects just $30 oil breakeven prices.
By 2025, it expects to increase shale production by 50% and generate about $3 billion in free cash flow – about 10% of its total – from that part of the business.
Basically, Shell has a lot of growth levers to pull. Yet management is committed to only investing in the most profitable opportunities, funded in part with sales of less profitable assets.
While we can't know today how successful those plans will be, we can say this: Shell's 7% yield is likely safe, making it a potentially good source of income.
3: Valuation Is Good With Solid Long-Term Income and Return Potential
The way I value a company is by looking at what actual investors have paid during periods with similar fundamentals and expected growth rates.
I then apply the historical valuation to the dividend, as well as appropriate industry earnings and cash flow metrics.
Royal Dutch Shell Valuation Matrix
| Metric | Historical Fair Value (all Years) | 2020 | 2021 | 2022 |
| 5-Year Average Yield | 6.40% | $59 | $60 | $61 |
| 13-Year Median Yield | 5.74% | $66 | $67 | $68 |
| Earnings | 13.0 | $64 | $70 | $76 |
| Operating Cash Flow | 6.2 | $71 | $73 | $78 |
| EBITDA | 4.6 | $68 | $69 | $70 |
| EBIT (pre-tax profit) | 8.2 | $66 | $69 | $74 |
| Average | $66 | $68 | $71 |
(Sources: F.A.S.T Graphs, FactSet Research, Reuters', Gurufocus, YieldChart)
Most likely, the true worth of the company is between $59 and $71. I consider $66 to be a reasonable estimate of what Shell is worth today.
| Classification | Margin Of Safety for 8/11 Above-Average Quality Companies | 2020 Price | Yield |
| Reasonable Buy | 0% | $66 | 5.7% |
| Good Buy | 15% | $56 | 6.7% |
| Strong Buy | 25% | $50 | 7.5% |
| Very Strong Buy | 35% | $43 | 8.7% |
| Ultra-Value/Anti-Bubble Buy | 45% | $36 | 10.4% |
| Currently | 19% | $53 | 7.0% |
Here are my conviction ratings on Shell in 2020. Note that a "good buy" merely means I consider the margin of safety sufficient to warrant that recommendation. It does not mean everyone should buy any particular company.
In addition, neither I nor Dividend Kings' portfolios have plans to buy RDS right now. We already have high exposure to energy, and we have to prioritize higher-yielding and more stable cash flow options – such as safe midstream/MLPs – in order to satisfy both our mission of maximum safe income and prudent risk management.
RDS Growth Profile
- FactSet long-term growth consensus: 8.5% CAGR
- FactSet growth consensus through 2022: 9.9% CAGR
- Reuters' 5-Year consensus: N/A
- YCharts long-term growth consensus: 6.5%
- Historical growth rate: 0.6% CAGR EBITDA growth over 20 years, -5%-17% CAGR rolling growth rates
- Realistic growth range: 0%-9% CAGR
- Historical fair value: 4.5-5.5 EBITDA
Notice how volatile RDS' cash flow growth has historically been. According to the Graham/Dodd fair value formula, a company growing at zero over time is worth about 8.5 times earnings or cash flow.
Outside of bear markets and bubbles, the market has valued RDS at 4.5 to 5.5, whether it's growing at -5% or 17%.
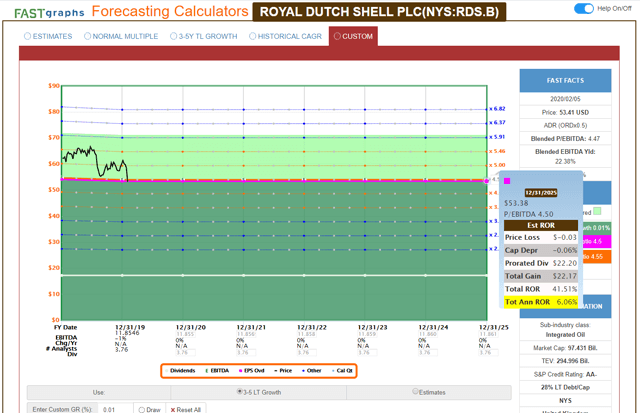
Remember that the market isn't wrong over the long term. It always factors in every company's strengths and weaknesses correctly. So let's take a look at what kind of long-term return potential (with high uncertainty) is possible here.
(Source: F.A.S.T Graphs, FactSet Research)
Let’s say that RDS doesn't grow at all over the next five years. In that case, its 7% yield should still help deliver about 6% CAGR total returns.
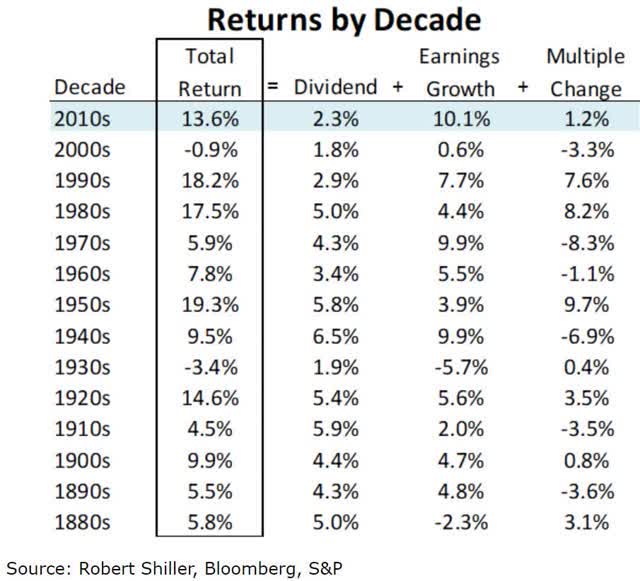
That might sound disappointing to anyone who thinks the market's 13.6% CAGR rally over the last decade was normal.
(Source: Ploutos)
But it's not. CAGR of 9.2% is the market's historical return since 1871, using Robert Schiller's database. And it’s 7% after inflation returns are the norm. The same is true over 200 years based on research from Graham/Dodd and Chuck Carnevale.
The historical 7% CAGR real return for stocks is actually the basis for the Graham/Dodd fair value rule of thumb. It says that buying companies at 15x earnings/cash flow is "sound" and "reasonable" as long as they’re growing between 3.25% and 15% CAGR.
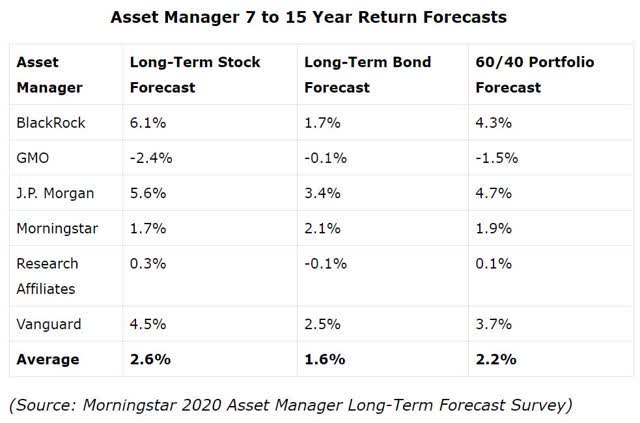
The same Gordon Dividend Growth Model each of the Dividend Kings has used for years – or decades – also underpins the long-term return forecasts for stocks/bonds from the leading asset managers.
The consensus is for about 3% CAGR stock returns. Though my model says about 6% on the S&P 500 are likely (the same as with BlackRock's model).
So Shell, from today's valuation, should at least match or beat the broader market, if only due to its high and safe dividend, which is likely to grow very slowly over time.
(Source: F.A.S.T Graphs, FactSet Research)
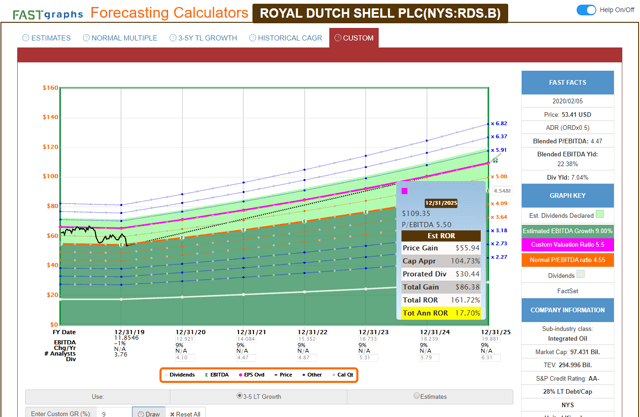
On the upper end of realistic return potential, there's the potential for 9% CAGR growth and a return to the upper end of fair value, which is a modest 5.5x EBITDA. That could potentially deliver about 18% CAGR long-term returns, or about three times what the broader market is likely to deliver.
(Source: F.A.S.T Graphs, FactSet Research)
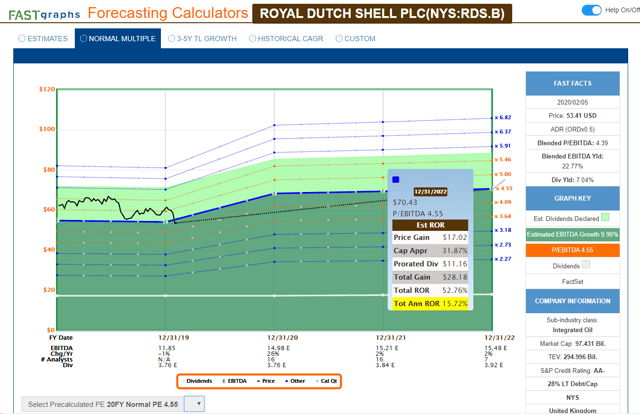
IF RDS grows as expected through 2022, which is far from certain since it continues to trade near the low end of historical fair value, investors might see about 16% CAGR total returns during the next three years.
Note the relatively high growth and return potential uncertainty for RDS and its fellow big producers. But that's the price you pay for an industry whose growth is ultimately at the mercy of global economic conditions and volatile energy markets.
4: Risks to Consider and Why RDS Isn't Right for Everyone
Shell's biggest short-term fundamental threat continues to be relatively higher debt. As Moody's points out (emphasis added):
Shell's rating is unlikely to be upgraded taking into account the company's financial policy, which balances shareholder's and creditor's interest but does not aim for a financial profile as strong as it has been before 2015 when Shell was rated Aa1. However, sustained stronger cash flow generation, with RCF/net debt solidly positioned in the 40% range or higher would put positive pressure on the rating. While unlikely at this stage, a deterioration in the financial profile, with RCF (retained cash flow)/net debt falling sustainably below 25% as a result of lower oil prices, high shareholder remuneration and a failure to reduce its net debt level, could put negative pressure on the stable outlook and Aa2 ratings of Shell.
While the BG acquisition integration has gone relatively well, Shell's ability to deleverage while targeting $25 billion in buybacks through 2020 will depend on oil prices. Due to ongoing low energy prices, Shell has said it will be missing its buyback target, though it plans to eventually complete it.
(Editor’s Note: Moody's is using a base case of $65 Brent oil prices (the global standard) in its current financial models.)
(Source: Ycharts)
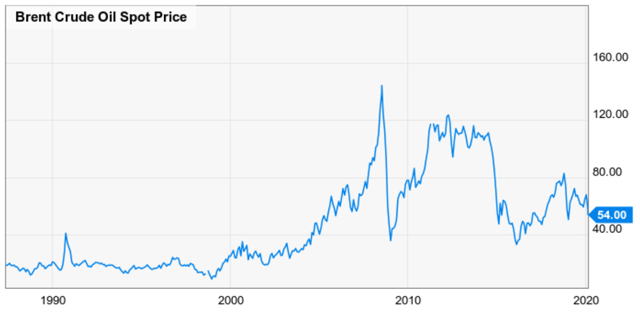
As Bloomberg reported, Brent recently crashed to $54 on a temporary reduction in Chinese demand:
Chinese oil demand has dropped by about 3 million barrels a day, or 20% of total consumption, as the coronavirus squeezes the economy, according to people with inside knowledge of the country's energy industry. The drop is probably the largest demand shock the oil market has suffered since the global financial crisis of 2008 to 2009. And the most sudden since the Sept. 11 attacks. It could force the hand of OPEC and its allies, which are considering an emergency meeting to cut production and staunch the decline in prices."
OPEC has initiated an emergency meeting, with it and Russia (a.k.a., the Vienna Consensus) discussing cutting production by another 500,000 barrels per day (bpd). CNBC quoted John Kilduff, partner with Again Capital, as saying that, “The speculation is that the Saudis are pushing for a minimum of 500,000 barrels.” However, “The Russians apparently are balking.”
(Source: Johns Hopkins)
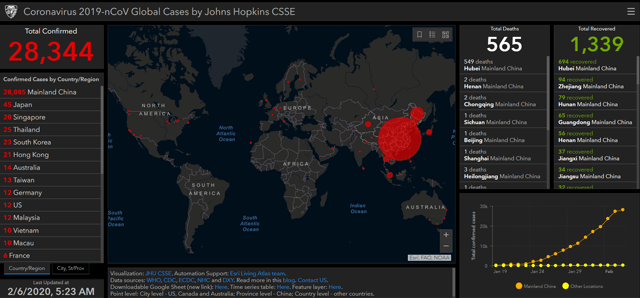
To be clear: The coronavirus outbreak is so far limited to mainly Wuhan itself. So what effects could the outbreak have on Chinese growth in 2020?
- JPMorgan estimates Q1 growth will fall by about 1% and spring back in Q2, reducing 2020 growth by about 0.1%.
- Economist Intelligent Unit estimates about 1% slower growth in China this year.
- AllianceBernstein estimates 0.8%-1.9% slower growth depending on how long the outbreak lasts.
Now, it's important to realize that I'm not advocating market timing. Not about Wuhan or anything else.
(Source: MarketWatch)
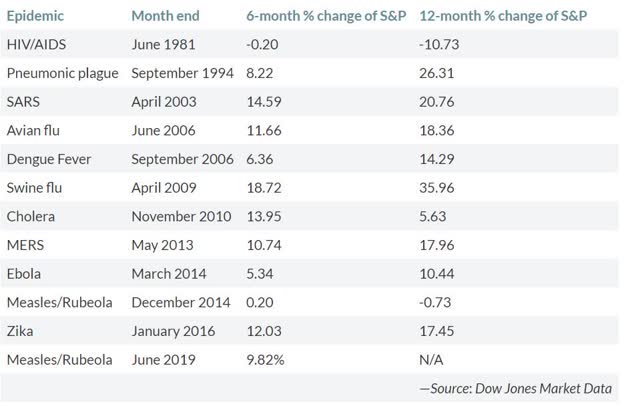
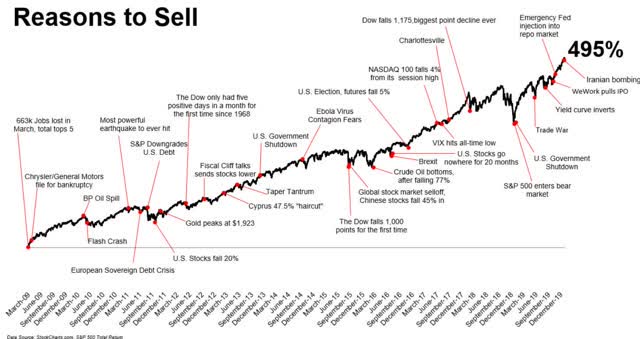
Epidemics are common. They almost always see stocks are up within six months, with fears fully shaken off within a year.
(Source: Michael Batnick)
Besides, stocks always are climbing a wall of worry composed of some scary headline. Yet the probability of stocks going up in any three-month period (since 1926) is 70%.
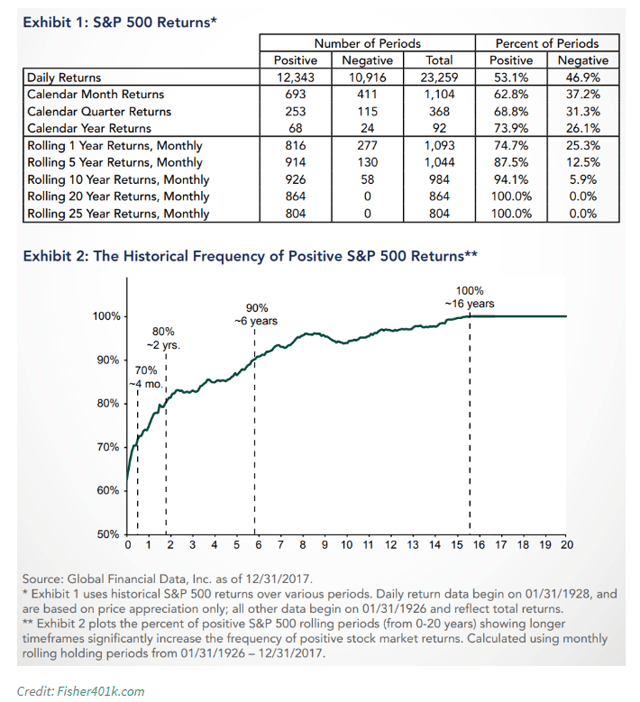
Stocks go up 75% of years, with the average intra-year decline since 1990 being 13.8%.
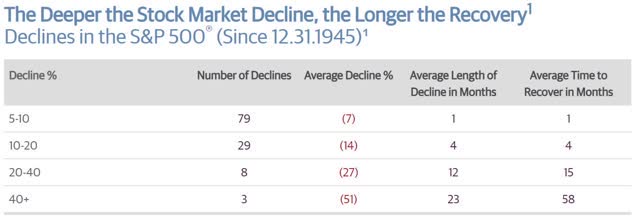
In other words, just because stocks are naturally volatile over time – on average suffering 5%-19.9% pullbacks/corrections every six months (since both 1945 and 2009) – that’s no reason to try to time the market.
(Source: Guggenheim Partners, Ned Davis Research)
The average pullback, measured from record high to record high, lasts two months. The average correction lasts eight months and includes a 14% peak decline.
That's the same average intra-year decline we've had since 1990, according to JPMorgan Asset Management. Bottom line: Volatility and valuation risk are something investors need to always think about and make peace with.
RDS is undervalued based on strong 2020 growth forecasts. And yes, if oil prices tank due to Wuhan hurting Chinese oil demand for longer than expected, Shell’s 2020 fundamentals might miss by a wide margin. That would reduce its discount to fair value and margin of safety.
(Source: YCharts)
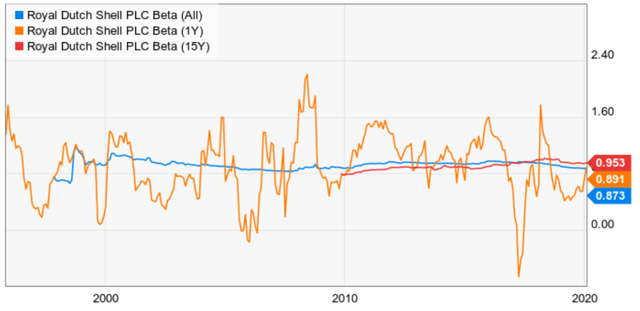
RDS' long-term beta is just 0.87, meaning it’s slightly less volatile than the S&P 500. But during periods of market stress (i.e., recessions, corrections, etc.), volatility can spike to 1.5 or even 2+.
RDS Peak Declines Since 1988 Vs XOM
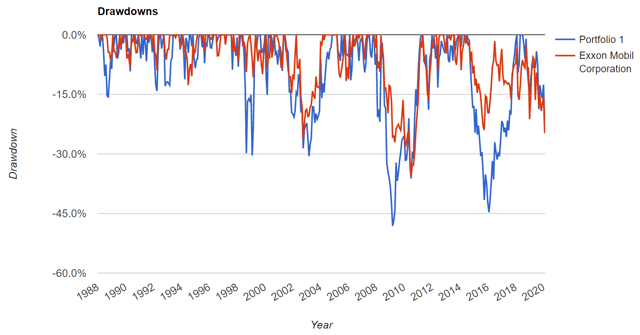

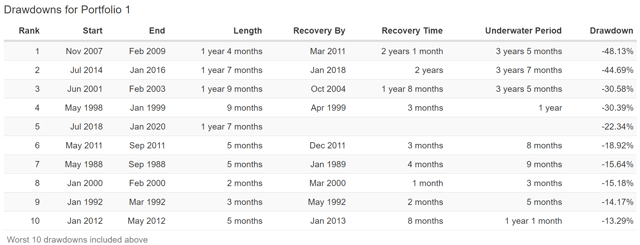
(Source: Portfolio Visualizer) portfolio 1 = RDS
The market agrees with my assessment of RDS' quality relative to Exxon, as seen by its higher volatility during periods of market stress. RDS is a fine high-yield investment in absolute terms, but it's also a volatile company that’s suffered five bear markets during the past 32 years.
Its current bear market of a 22% peak decline (including dividends) is mild. So investors should be prepared for potentially large short-term declines should the broader market suffer a pullback/correction.
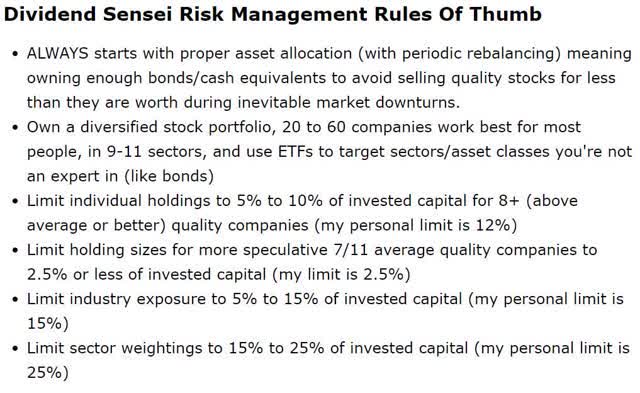
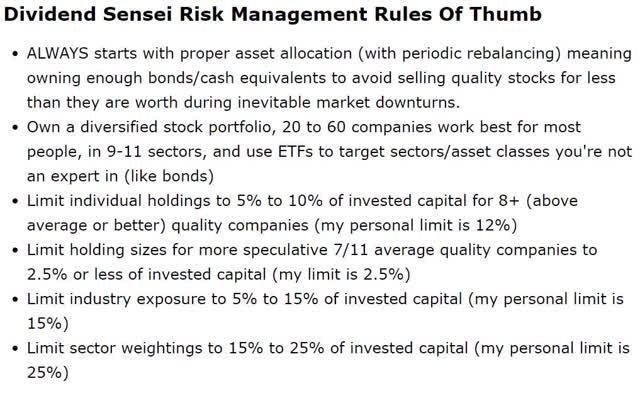
That's where prudent risk management comes into play, summed up in the risk management guidelines above. I use them for all our portfolios and my retirement portfolio, where I keep 100% of my life savings.
Notice how proper asset allocation, including the right mix of stocks/bonds/cash equivalents, is the first thing to focus on. None of my stock recommendations is EVER to be taken as a bond alternative.
Bonds and stocks are nothing alike outside of the fact that they both generate income. Bonds are a non-correlated asset class that holds up well during periods of market fear.
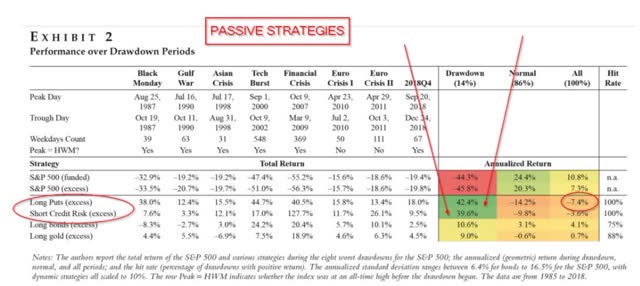
A Duke University study found that bonds are the best passive way to hedge your portfolio, being the only one of four passive strategies to generate positive long-term returns across the market cycle.
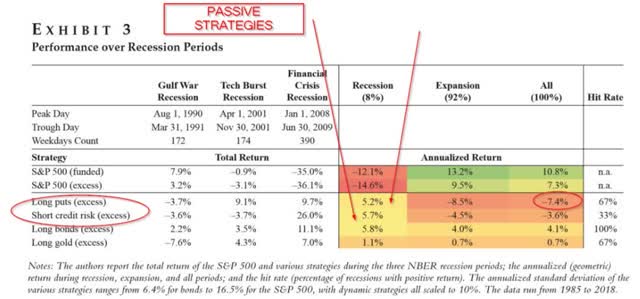
(Source: Duke University)
Essentially then, RDS could be a fine choice for a well-diversified and prudently risk-managed portfolio. Just not one I personally plan to buy in the near term.
That's not a knock on its quality or dividend safety. Only a matter of having limited capital to put to work and having far better-suited alternatives available that fit my needs.
Bottom Line: Royal Dutch Shell Is a Sound, High-Yield Choice Right Now if You're Okay With Its Cyclical Business Model
Shell is a fine holding for anyone seeking a safe 7% yield and exposure to potential upside in oil prices. It's a large, diversified, and competently run industry giant with strong access to low-cost capital that should help see it through any industry downturns.
However, while it’s about 19% undervalued for 2020's expected fundamental results – as with all oil companies – there’s a high amount of uncertainty surrounding its valuation and long-term growth potential. Anyone interested in Shell should keep in mind that it’s probably not going to grow rapidly in the long run.
RDS is famous for its stable dividend across industry/economic cycles, not steady dividend growth. For the next 10-20 years, its dividend should remain safe, courtesy of its competent management team and sound long-term strategy of diversifying into LNG.
Shell also is ahead of the curve on diversifying into alternative energy, though that part of the business will likely remain relatively small for the foreseeable future.
Right now, it’s a good buy, but only for income investors who recognize and accept its strengths and weaknesses, including higher volatility relative to dividend aristocrat peers like Exxon.
Author's note: Brad Thomas is a Wall Street writer, which means he's not always right with his predictions or recommendations. Since that also applies to his grammar, please excuse any typos you may find. Also, this article is free: written and distributed only to assist in research while providing a forum for second-level thinking.
Managing Risk Is What We Do Best
iREIT on Alpha is one of the fastest-growing marketplace services with a team of five of the most experienced REIT analysts. We offer unparalleled services including five customized portfolios that are doing extremely well in the moment - but are built to stand the test of time too.


Disclosure: I/we have no positions in any stocks mentioned, and no plans to initiate any positions within the next 72 hours. I wrote this article myself, and it expresses my own opinions. I am not receiving compensation for it (other than from Seeking Alpha). I have no business relationship with any company whose stock is mentioned in this article.