Portfolio Protection: Time Will Come When Silver Shines Brighter
by Damir BobojanovSummary
- This precious metal has constantly lagged behind gold, but everybody knows perfectly well the time will come when silver shines brighter.
- An unexpectedly long bullish market should eventually end. Having some protection will not hurt.
- Gold is trading between 1500 and 1600. Silver has had remarkable growth too, but it is probably still undervalued in comparison to gold.
- Silver may support an investment portfolio and provide handsome returns in the long run.
If you are growing ever-cautious with the passing of time since the last crisis of 2007-2008 and have decided to look closer at precious metals for protection, then you have arrived at the same page where I currently am. If the financial fracture comes, sooner or later, silver may easily outperform gold. The road will be volatile though. This precious metal has constantly lagged behind gold, but everybody knows perfectly well the time will come when silver shines brighter. I want to go through the metal's life and investing cycle to get to the best position to start accumulating silver. Silver is relatively cheap when compared to gold, but is it cheap enough to start building a position? In this article, I will try to answer this question. I look at two ways to invest in silver - they are the Aberdeen Standard Physical Silver Shares ETF (SIVR) and the Sprott Physical Silver Trust (PSLV). You could also try the iShares Silver Trust ETF (SLV), but the expense rate is higher there.
(Source: The Silver Institute)
Why some protection won't hurt
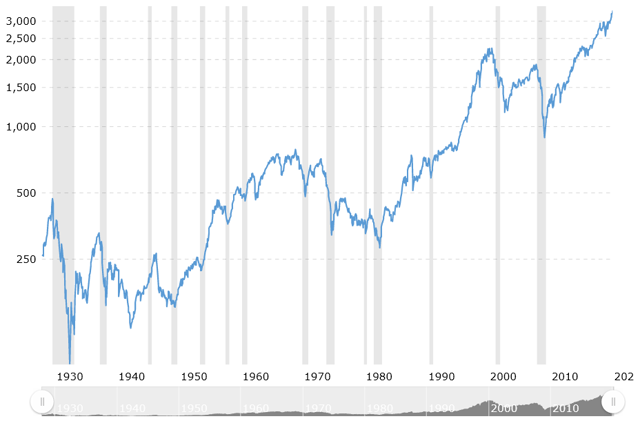
There are several reasons that are pushing me to think more about portfolio protection. One of them is the unexpectedly long in the tooth bullish market which could have long ended had financial institutions had problems with liquidity. But they don't - serious corrections are being bought out, and thus, negative sentiment has no chance to leak to the real economy. Let's look at the history of S&P 500 - you can see that time gaps between recessions more often than not end before the 10-year mark.
(Source: Macrotrends)
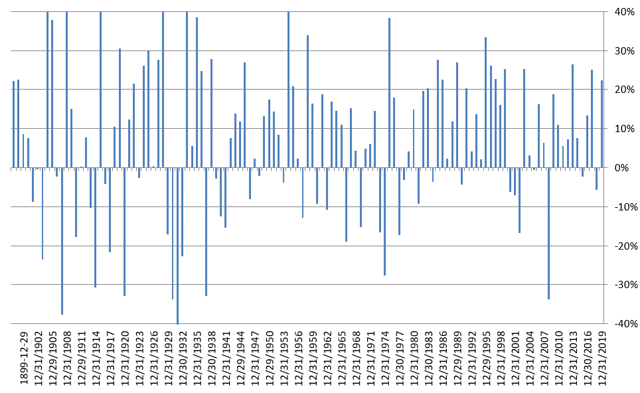
The next chart shows Dow Jones' annual returns since 1896, or for the past 123 years. Very positive (above 20%) returns are rarely followed by similar performance. It's ok to expect less of 2020; it's reasonable enough to expect a result between the average of +7.5% and -14.8%. Mr. Market won't go easy on us even between these mild estimates, and it means volatility and, thus, a considerable amount of action in precious metals.
(Source: Author's estimates)
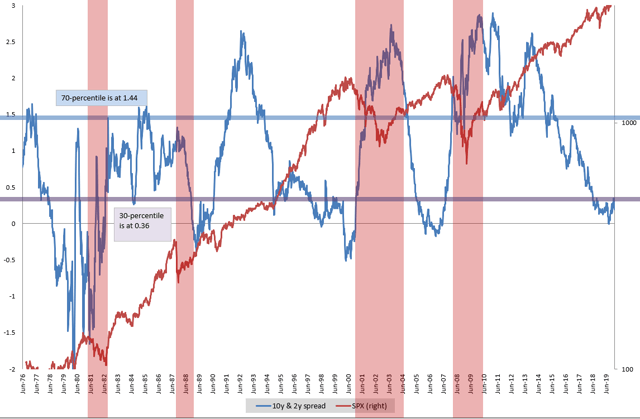
Of course, I cannot skip the following chart showing the spread between 10- and 2-year yields of US Treasury notes. Usually, the spread shrinks down to zero just before a crisis happens. Transparent red bars indicate periods when the SPX crumbled big time and panic hadn't yet eased. The last three bars tell that when the spread hits the ground, markets don't immediately plunge, but take a year or year and a half to think a little. And then S&P 500 starts its free fall, while the spread widens back.
(Source: Bloomberg)
S&P 500 reached the level of 3230.78 on December 31, 2019, a +28.8% appreciation. Its preliminary EPS grew to $162.35, adding only +9.44%. No matter how hard an analyst may try to justify the following paces of growth, still, the stock market is ahead of earnings by 20-30%. And the US economy doesn't look like it's ramping up speed.
| Earnings Growth | SPX Growth | |
| Since 2006 | 85.08% | 127.79% |
| Since 2007 | 96.69% | 120.03% |
| Since 2008 | 227.91% | 257.68% |
| Since 2013 | 51.30% | 74.79% |
(Source: Leonard N. Stern School of Business and author's estimates)
Why silver over gold?
Once we established that the market might be preparing an unpleasant surprise for us, it becomes logical to get precious metals on board to offset part of the risk. I plan to reserve 15-30 percent of my portfolio for this purpose. Gold is the number one choice due to its historically monetary role. Unfortunately, it seems to me that I might be late for this party, since the price is 25-30% higher than I prefer it to be. Gold is trading between 1500 and 1600. Silver has had a remarkable growth too, but it probably still undervalued in comparison to gold, and this gives me a margin of safety in a sense. The ratio of these two metals speaks in favor of silver on a purely statistical basis. Here, we have the second-highest of the last 40 years' digression from the mean.
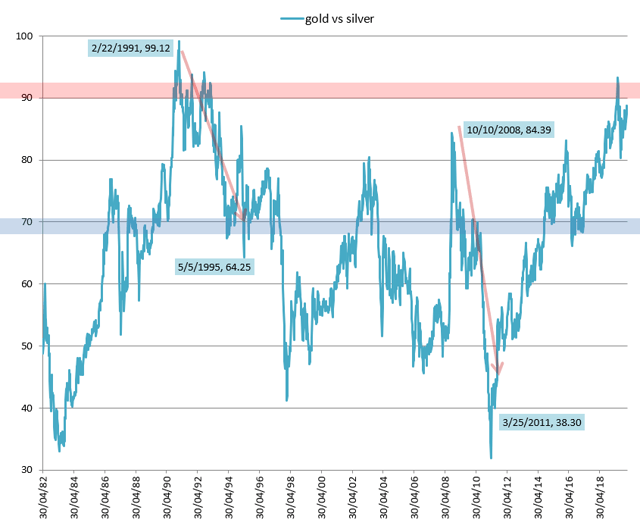
(Source: Bloomberg)
Here is a summary of the article titled "The Gold to Silver Ratio" here at the Free Bullion Investment Guide. I suggest reading the original in full.
From the 12th century to the early 18th century, silver traded roughly at or near a 12:1 ratio with gold. In the 16th century, after the Spanish discovered large deposits of silver ore in South and Central America, a "Silver Standard" was created. In 1717, Sir Isaac Newton introduced a fixed ratio between gold and silver of 15½:1. The Coinage Act of 1834 also changed the gold to silver ratio, by a half an ounce, to 16:1, valuing gold at $20.67 a troy ounce. The United States embraced the Gold Standard and demonetized silver the Coinage Act was labeled by those who wanted to keep silver monetized as the "Crime of 1873.
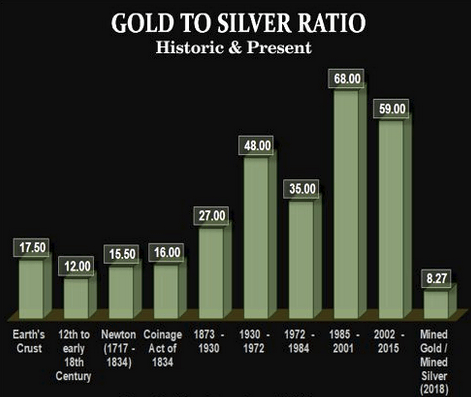
(Source: Free Bullion Investment Guide)
We can conclude here that, although nobody can tell when, silver has true fundamental reasons to get back at gold. The next crisis will happen someday, and it has the power to boost silver more than gold. That is why I go with silver. In a way, it can serve as double-volatility ETF on gold.
What drives silver?
Industrial demand for gold doesn't exceed 10% a year. More than 50% of silver is used for industrial purposes annually. Here is why:
- Silver is also one of the world’s best conductors of electricity, allowing its use in electronic components such as wires, switches and printed circuit boards. The combination of ductility and electrical conductivity makes silver perfect for micro-electronics devices such as smartphones, where it can be bent and squeezed into tiny spaces without breaking.
- The metal has a unique property of penetrating bacteria cell walls - while not harming mammalian cells - and destroying the ability of the microbe to reproduce. This allows silver ions to be employed as a biocide, which is growing increasingly important as overuse of chemical antibiotics is causing some bacteria to become immune.
Over the last decade, the metal has started to shine brighter for investors. In 2009, around 63% of silver was used for technological applications and only 9% for storing value. In 2018, "Coins and Bars" were responsible for 17.4% of annual demand, whereas technological applications took only 56%. We have experienced a renaissance of silver's monetary function. This perfectly connected with the money-printing activity of central banks worldwide. Fiat currencies do become softer, and even cryptocurrencies have shown the same pattern.
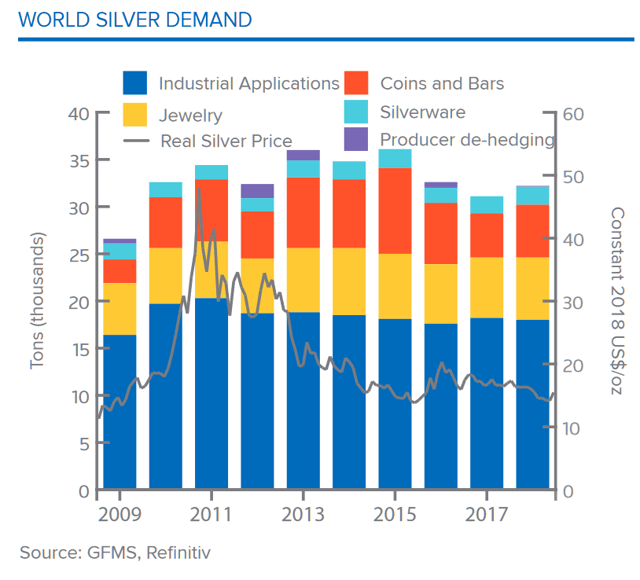
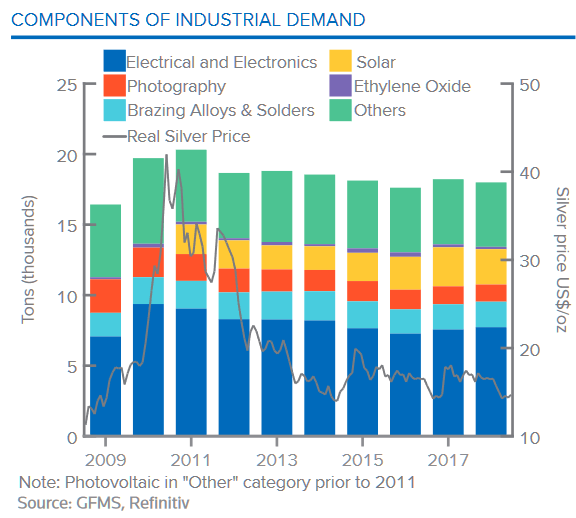
(Source: The Silver Institute - World Silver Surveys)
Operating mines are distributed evenly enough around the globe. Silver is found in the earth’s crust on its own in a pure form known as "native silver." More commonly, it is mined as a secondary metal mainly found combined with gold, copper and lead, from which it must be separated. The following chart indicates stagnation in mine production, which is favorable if silver continues to attract long-term holders, because at a critical point, the inelasticity of supply won't allow it to meet demand in a timely manner. It usually wind ups with price spikes; examples can be found in the years 2011 and 2016.
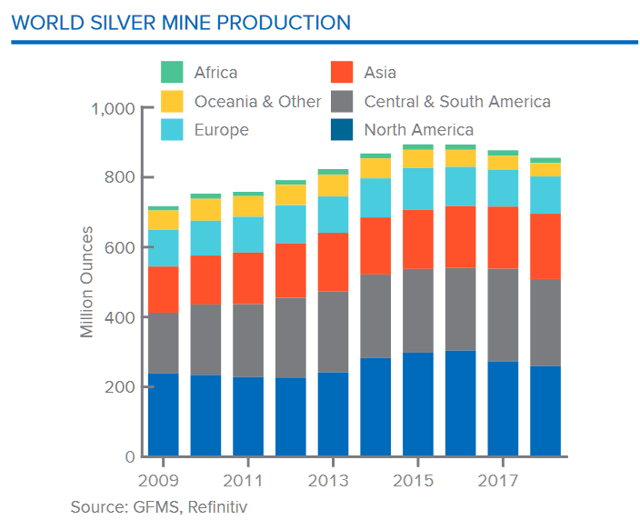
(Source: The Silver Institute - World Silver Surveys)
When is the time to buy silver? Investment thesis
Well, I guess the best moment was in the fourth quarter of 2018 and in the second quarter of 2019, when the gold-to-silver ratio was at the highest. Perfect timing may be gone, but in light of cyclicity in the economy and in stock markets, the brightest days of silver are still ahead of us. No rush, though. Gradually, bit by bit, I plan to establish a position of 15-20% in silver and 10% in gold if it falls by 15%. If the market proves me wrong, well, I have 60% in stocks and no desire to sell them anytime soon. On the other hand, if a financial meltdown occurs, having a long-term cushion won't hurt.
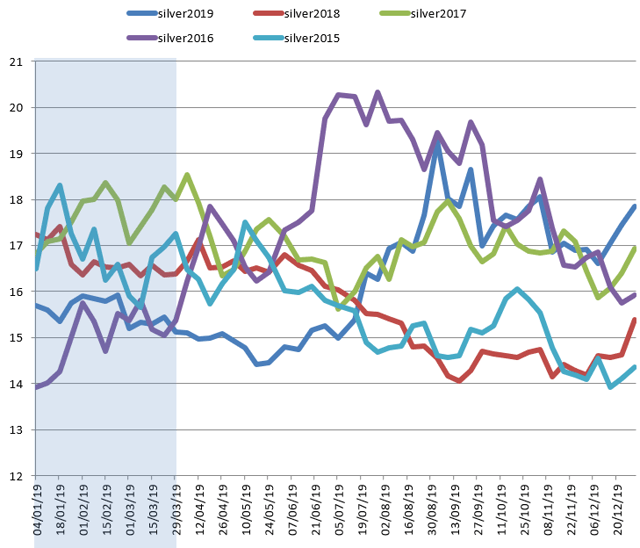
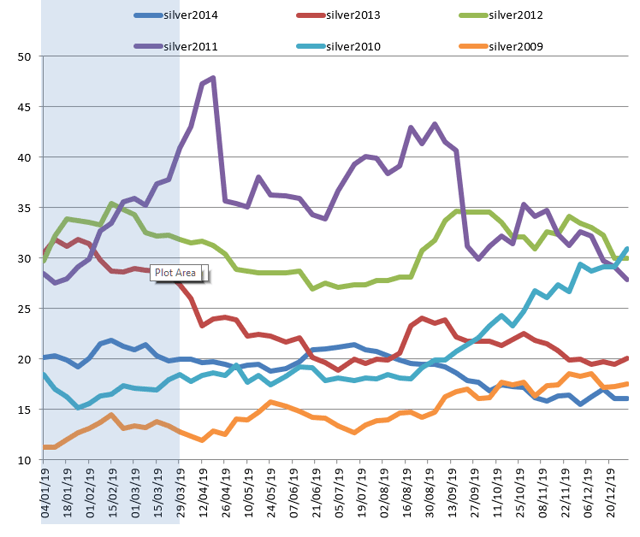
If you look at the following charts of silver price performance during a year for every year since 2009, you can tell that the second and fourth quarters are usually the weakest for silver. Except for 2011 and 2016, where silver strongly performed. No one knows the future, so I will try to get 5-7% in the first quarter and 5-7% in the second if silver continues to drop in 2020.
(Source: Bloomberg)
There are several reasons to make a case for silver:
- If a random investor got into precious metals when the gold-to-silver ratio was at 89 in 1991 and stayed there for 3 years, then his returns would have looked like this:
| 10/11/1991 | 8/26/1994 | Gain | Per Annum | |
| Silver | 4.05 | 5.23 | 29.14% | 10.13% |
| Gold | 357.75 | 383.7 | 7.25% | 2.52% |
| Platinum | 356.75 | 411.5 | 15.35% | 5.33% |
- If he did it in 2003 with the ratio at 75, then the result would have been:
| 10/10/2003 | 8/25/2006 | Gain | Per Annum | |
| Silver | 4.9 | 12.4 | 153.06% | 53.21% |
| Gold | 373.05 | 622.525 | 66.87% | 23.25% |
| Platinum | 730.5 | 1221.5 | 67.21% | 23.36% |
- If he did it in the height of the crisis in 2008 with the ratio at 80:
| 12/5/2008 | 10/21/2011 | Gain | Per Annum | |
| Silver | 9.53 | 31.3862 | 229.34% | 79.72% |
| Gold | 756.45 | 1642.375 | 117.12% | 40.71% |
| Platinum | 803 | 1513.25 | 88.45% | 30.75% |
Those are different cases in different cycles. However, the ratio is just too good to ignore this probability.
Risks
- The gold-to-silver ratio has the other way to get back to its average when both metals drop but gold drops a bit harder.
- An election year can be still positive for the stock market, and silver may lose eventually.
- During times of heavy volatility, silver isn't bullet-proof; in fact, it lost 50% of its price in 2008.
Disclosure: I/we have no positions in any stocks mentioned, but may initiate a long position in SIVR over the next 72 hours. I wrote this article myself, and it expresses my own opinions. I am not receiving compensation for it (other than from Seeking Alpha). I have no business relationship with any company whose stock is mentioned in this article.