Lumber Is Quietly Rising
by Andrew HechtSummary
- Lumber has not followed crude oil and copper.
- An industrial commodity for construction.
- Rates in the U.S. favor new home building.
- Levels to watch in the lumber futures market.
- The futures are dangerous; WOOD is a better choice for risk positions.
Over the past four decades, I have traded at least one contract of almost every commodity on the futures market. However, I have never set foot near the lumber market. The volume and open interest, the total number of open long and short positions, in the lumber market have always been at levels that do not provide adequate liquidity. Slippage is the loss that a trader or investor experienced when executing buy or sell orders. In the lumber futures arena, slippage tends to be too high to justify any risk position. The lack of liquidity makes bid-offer spreads wide and often creates gaps when the price makes a move higher or lower. While I do not trade lumber futures, I watch the price like a hawk.
Lumber is an industrial commodity, and its price action can be as significant as crude oil or copper. Each reflects the overall state of the economy. Wood is a critical requirement when it comes to building infrastructure. Moreover, lumber is one of the primary ingredients in new home building. A booming housing market in the US is a bullish factor for the price of wood. The iShares Global Timber and Forestry ETF product (WOOD) holds shares in many of the leading companies around the world involved in the lumber business. WOOD is a lot more liquid than lumber futures, but it moves higher or lower with the price of the industrial commodity.
Lumber has not followed crude oil and copper
The "phase one" trade deal between the US and China that de-escalated the trade war that began in 2018 and caused more than a little indigestion in markets across all asset classes should have been bullish news for industrial commodities. Crude oil powers the world, and copper is a barometer of the overall health and well-being of the global economy. Both the energy commodity and nonferrous metal are highly sensitive to global and Chinese economic growth. China is the world's most populous nation with the second-leading GDP. News of the trade agreement lifted the price of copper, which rose to a high of $2.8860 per pound in mid-January. Copper traded to a low of $2.4675 in early September when US President Trump slapped tariffs on the Chinese escalating the trade dispute.
Crude oil followed a similar path as the price rose from $50.52 in early August to over $60 per barrel in early January. While the trade deal provided some support for the price of oil, rising tensions between the US and Iran pushed the price to a high of $65.65 per barrel on January 8. The bullish price action in the oil and copper markets came to an end as China faced another problem. The outbreak of coronavirus trumped the "phase one" trade deal, and the prices of the two industrial commodities fell off the slide of a bearish cliff.
Source: CQG
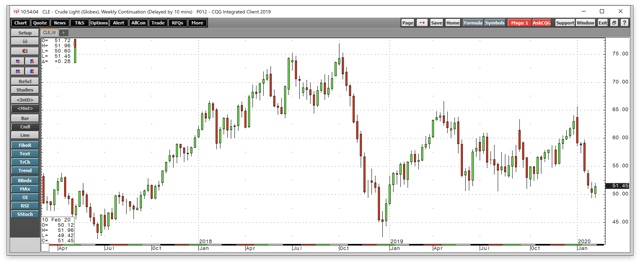
The weekly chart of NYMEX crude oil futures shows that the energy commodity experienced five consecutive weeks of losses, falling from $65.65 in early January to its most recent low of $49.31 on February 4. If the price closes below $50.34 on Friday, February 14, it will mark the sixth straight week of losses.
Source: CQG
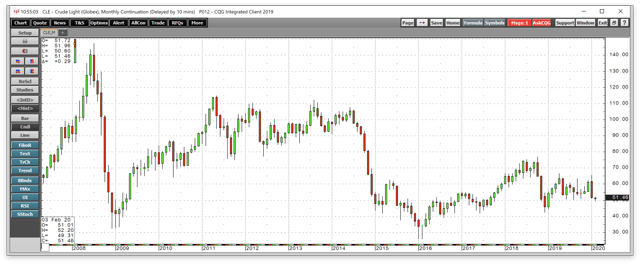
The monthly NYMEX crude oil chart shows that the energy commodity put in a bearish reversal pattern in January. The price moved to a higher high than in December 2019 and settled the month below the lows of the final month of last year. On Thursday, February 13, the price of nearby March futures was trading at $51.45 per barrel, not far away from the recent low.
The price action in the copper market was similar to oil's.
Source: CQG
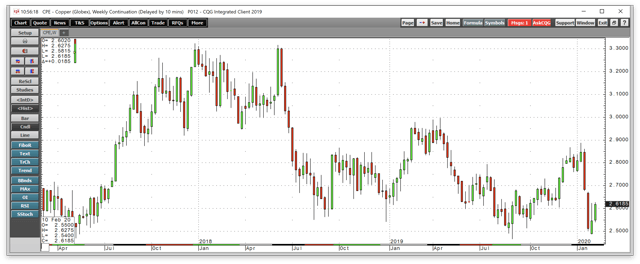
The weekly chart shows that copper futures fell from $2.8860 in mid-January on the day after the Chinese and the US signed the trade deal, to a low of $2.4875 on February 3. As fear and uncertainty over the coronavirus caused risk-off conditions in markets, the price of copper fell within two cents of the early September low, which was the lowest price since 2016.
Source: CQG
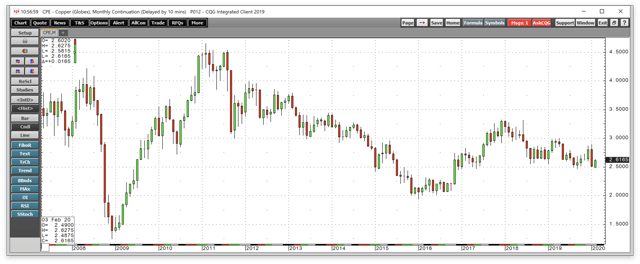
The monthly chart of COMEX copper illustrates that the base metal also put in a bearish reversal in January. March copper futures bounced and were trading at the $2.6165 per pound level on February 13.
The outbreak of coronavirus sent the two industrial commodities appreciably lower, but the lumber market did not follow.
An industrial commodity for construction
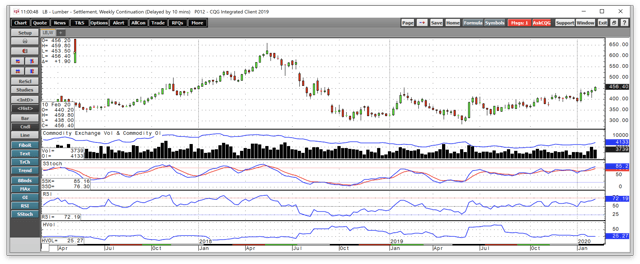
Lumber prices ignored the price action in the crude oil and copper futures markets and continued to move higher in a rally that began during the week of May 28, 2019.
Source: CQG
The weekly chart shows that the lumber market ignored the escalation and de-escalation of the trade war in August 2019 and January 2020. The price rose from a low of $286.10 in late May to its most recent high of $459.80 on February 13. Price momentum and relative strength indicators are rising towards overbought readings. After an initial spike in weekly historical volatility to the 65% level, it has been at a far lower level around 25% since October 2019. The decline in the measure of price variance reflects the slow and steady rally in the price of lumber futures.
Source: CQG
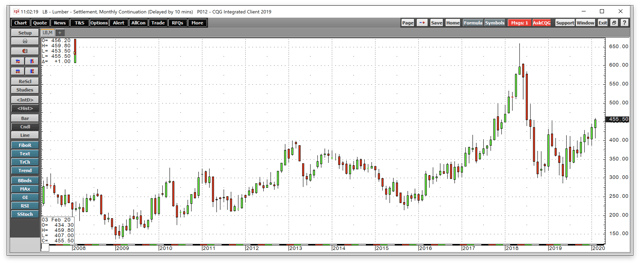
The monthly chart of lumber futures shows that trade wars and the potential of a pandemic have not stopped the ascent of the price of wood. The target on the upside stood at $453.90, the high from February 2019.
The prospects for increasing lumber demand have been bullish for the price of the industrial commodity as lumber is following interest rates.
Rates in the U.S. favor new home building
Lumber is an industrial commodity that follows the ups and downs of the US bond market. High interest rates can weigh on the demand for wood as mortgage rates increase but falling interest rates can ignite the price of lumber on the upside.
A combination of a trade dispute with neighboring Canada and the perception that rates would move higher, causing a rush to purchase new homes and lock in mortgage rates, caused the price of lumber futures to rise to an all-time peak of $659 per 1,000 board feet in May 2018. However, as the US, Canada, and Mexico agreed to replace NAFTA with the USMCA, and the Fed hiked rates by a full one percentage point, the price of lumber crashed, falling 56.6% from May 2018 through May 2019. The bulk of the move occurred by October 2018 when lumber first probed below the $300 per 1,000 board feet level. The latest support for lumber has come from a rising bond market and lower mortgage rates in the US.
Source: CQG
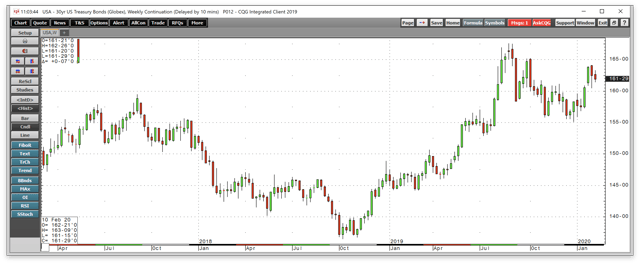
The weekly chart of the 30-Year Treasury Bond futures shows the move from a low of 136-16 in October 2018 to a high of 167-18 in late August. At 161-29 on February 10, not far below the high. Shares of homebuilding companies Lennar (LEN) and Toll Brothers (TOL) have been moving higher in a sign of robust demand for new homes, which translated to demand for wood.
Levels to watch in the lumber futures market
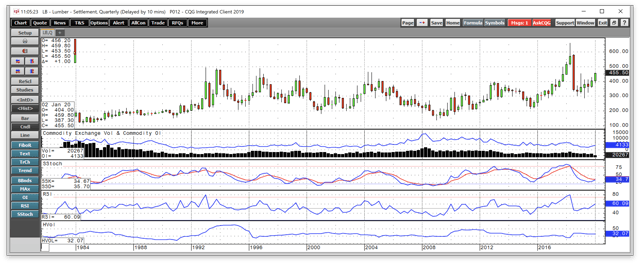
Lumber futures were probing above the $450 per 1,000 board feet level on February 10 for the first time in a year. The first level of critical technical resistance on the upside was $453.90.
Source: CQG
The quarterly chart shows that price momentum is attempting to cross higher at below a neutral reading. Relative strength has already climbed above neutral territory. The slow and steady rally over the past months has kept quarterly historical volatility in check as below 32%. Recently, the total number of open long and short positions in the lumber futures market rose from 1,927 contracts in early September to 4,133 contracts as of February 12. While the open interest metric remains at a level that reflects limited liquidity, rising price and increasing open interest tend to be a validation of a bullish trend in a futures market.
Technical support is at $400, $350, and the $300 levels in the volatile lumber futures arena. On the upside, the $453.90 level could turn out to be the gateway of another moonshot move towards the 2018 all-time high of $659 per 1,000 board feet.
The futures are dangerous; WOOD is a better choice for risk positions
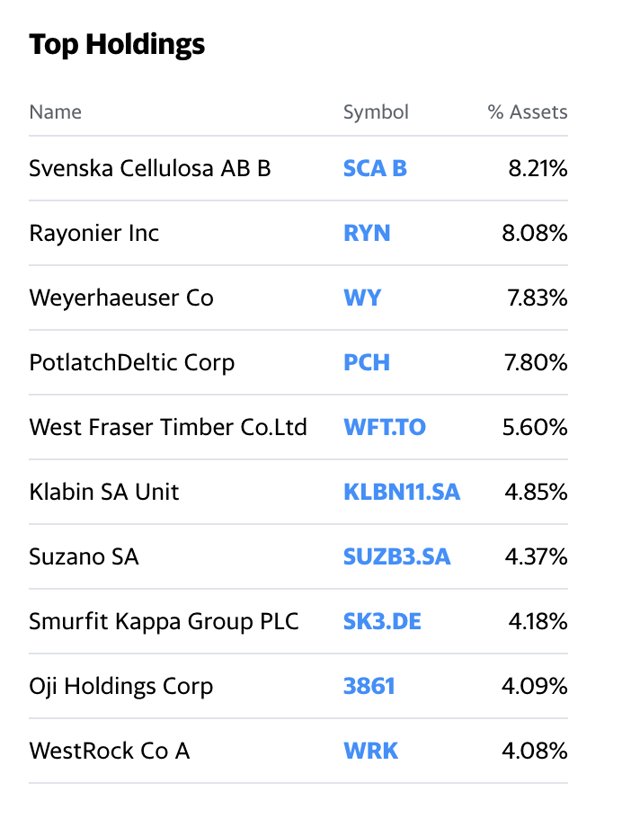
One of the products I favor when bullish on the lumber market is the iShares S&P Global Timber & Forestry Index ETF product. WOOD holds a diversified portfolio of companies with exposure to the lumber market. The most recent top holdings include:
Source: Yahoo Finance
WOOD has net assets of $245.13 million, trades an average of 45,803 shares each day, and charges an expense ratio of 0.46%. The blend of shares in WOOD offered a dividend yield of 1.97% at $63.37 per share on February 13.
Source: Barchart
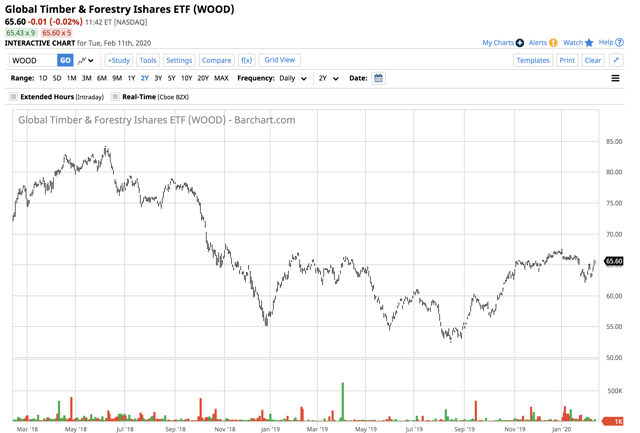
Lumber rallied from May through early February. WOOD shares reached a low in mid-August 2019 at $52.75 and were trading at $65.60 per share on February 10, just over 24% higher over the period. WOOD tends to follow the price of lumber futures, but it often underperforms on the upside and outperforms when the price moves lower.
The trend in the lumber market has been higher, and interest rates do not appear to be rising any time soon. 2020 is an election year in the US, and the Fed will likely not make any monetary policy changes until after the November election. With 30-Year fixed-rate mortgages at 3.5% or lower in the US, unemployment at the lowest level in a half-century, and GDP growth the envy of the world, the demand for new homes and wood should provide support for the WOOD ETF product over the coming weeks and months. A period of risk-off trading across all asset classes could cause a correction in the WOOD product. However, selling in the stock market would send bonds higher, and mortgage rates even lower. Increased volatility could work in lumber's favor over the coming weeks and months.
The Hecht Commodity Report is one of the most comprehensive commodities reports available today from the #2 ranked author in both commodities and precious metals. My weekly report covers the market movements of 20 different commodities and provides bullish, bearish and neutral calls, directional trading recommendations, and actionable ideas for traders. I just reworked the report to make it very actionable!
Disclosure: I/we have no positions in any stocks mentioned, and no plans to initiate any positions within the next 72 hours. I wrote this article myself, and it expresses my own opinions. I am not receiving compensation for it (other than from Seeking Alpha). I have no business relationship with any company whose stock is mentioned in this article.
Additional disclosure: The author always has positions in commodities markets in futures, options, ETF/ETN products, and commodity equities. These long and short positions tend to change on an intraday basis.