Bill.com: Material Deceleration On The Horizon
by Taylor DartSummary
- Bill.com reported its fiscal Q2 2020 results last week, beating top line estimates and reporting 50% year-over-year revenue growth.
- Despite an incredible report, revenue growth rates are expected to slow going forward, with material deceleration on the horizon for fiscal Q4 2020.
- While the company's growth rates are incredible, the valuation is also an issue, with the stock trading at over 32x price-to-sales.
- Based on a high likelihood of material deceleration and a near-bubble like valuation, I believe investors would be wise not to chase the stock above $63.00 per share.
It's been an incredible start to the year for Bill.com (BILL), with the stock up 66% year to date and over 80% since its January 6th low. The stock's persistent outperformance is tied to a massive beat by the company on its fiscal Q2 2020 report released last week. Bill.com managed to put up a top line beat of over $5 million above estimates, reporting $39.1 million in quarterly revenue. This was not only a new record for the company, but it was the third quarter in a row of double-digit sequential sales growth. Despite this great news, there are two issues with buying at current levels, with the first being a high likelihood of deceleration in growth and the second being the stock's bubble-like valuation. Based on this, I believe investors would be wise not to chase above $62.00 per share, as the stock is extremely high-risk at current levels.
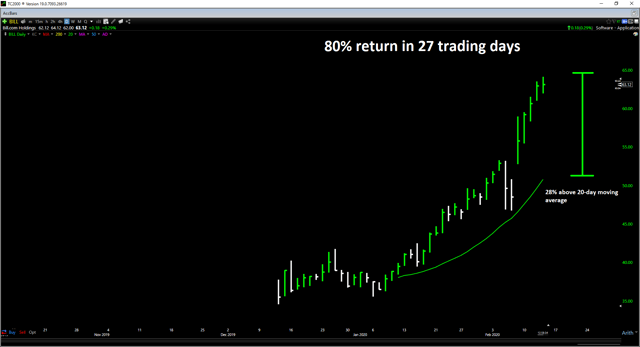
(Source: TC2000.com)
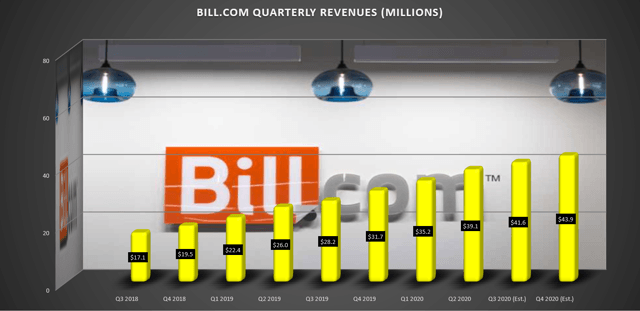
Bill.com reported its fiscal Q2 2020 results last week, wowing the market as it beat revenue estimates by more than $5 million, with quarterly revenue of $39.1 million. This marked a new quarterly record for the company and the third quarter in a row of double-digit sequential revenue growth. Unfortunately, despite this massive beat, it was still not enough to prevent material deceleration in the company's revenue growth rate sequentially. Bill.com's revenue growth came in at 50% year over year in fiscal Q2 2020, down from 57% in the prior quarter, marking a 700-basis point slowdown. Unfortunately, this is unlikely to be a one-off, as growth rates are expected to slow further going forward based on current estimates. Let's take a closer look below:
(Source: Author's Chart, YCharts, AccountingToday.com)
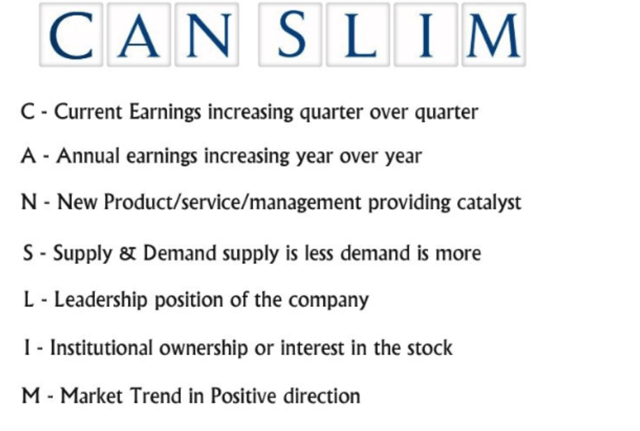
As we can see in the chart above, Bill.com has seen outstanding growth in the past two years, as few companies can maintain a double-digit run rate of sequential revenue growth. Bill.com has achieved this feat with ease, with seven of the past eight quarters showing revenue growth of 10% or higher and the most recent report coming in at 11% sequential growth ($39.1 million vs. $35.2 million). By this metric alone, Bill.com is a name growth stock investors should have a close eye on going forward. However, this is especially true given that the stock meets two of William O'Neil's CANSLIM criteria. For those unfamiliar with CANSLIM and William O'Neil, this esteemed growth stock investor built a checklist to hunt down the best growth stocks in the market and labeled this easy-to-remember checklist "CANSLIM."
(Source: Quora)
Bill.com meets both the New [N], and Leader [L] categories of O'Neil's CANSLIM criteria, and is a little reminiscent of Avalara (AVLR), which also carved out a niche for itself following IPO debut. When it comes to the "New" category, Bill.com is carving out its own niche in the automated payment software space. The company leverages artificial intelligence to aid in workflow automation, making tasks like account payables and receivables exponentially more efficient and less monotonous. Bill.com has claimed that its customers save an average of 36 business days annually, thanks to its software. As for the Leader [L] category, the company certainly fits the bill, outperforming both the S&P 500 (SPY) and all of its software peers with an over 60% return year to date. Therefore, given that the company meets two of the most critical CANSLIM criteria, it's undoubtedly a name to pay close attention to if the stock can set up a new technical base.
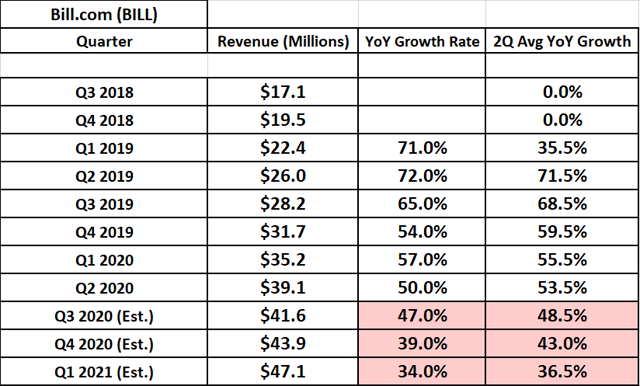
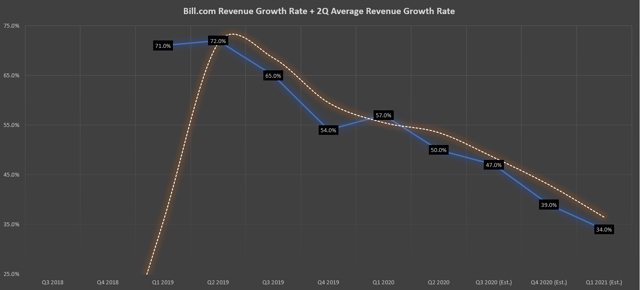
Circling back to the company's growth metrics, however, there is a definite negative here, and it's the material deceleration on the horizon for Bill.com. As the table shows below, Bill.com's quarterly revenue growth rate slipped by 700 basis points sequentially in fiscal Q2 2020, falling from 57% to 50%. Unfortunately, this slowdown is likely to continue, with forecasts for another 300-basis point deceleration in fiscal Q3 2020, according to current estimates. As we can see, the high end of fiscal Q3 2020 estimates is currently $41.6 million, translating to 47% growth year over year. This would not only be a deviation from the double-digit sequential revenue growth rate, but also a 300-basis point slowdown from the 50% growth rate in fiscal Q2 2020. It's important to note that a 300-basis point deceleration is not the end of the world for a growth stock, but it's the fiscal Q4 2020 estimates that are a little more alarming.
(Source: YCharts, Author's Table)
If we look at the fiscal Q4 2020 revenue estimates, we can see that they're currently pegged at $43.9 million, translating to 39% growth year over year from last year's $31.7 million in quarterly revenue. This would mark a quarter of material deceleration, with the revenue growth rate expected to slip 800 basis points sequentially (39% from 47%) and 1100 basis points from the most recent quarter's 50% growth. I classify material deceleration as a 500-basis point or greater slowdown sequentially, and this often is a headwind for a growth stock short term.
To confirm that this is indeed a meaningful deceleration and not a one-quarter anomaly, I like to use a two-quarter average for revenue growth rates, as it helps to smooth out any lumpy quarters. As the chart below shows, the two-quarter average revenue growth rate (white line) continues to sink and is expected to plunge below the 50% level as of fiscal Q3 2020. Worse, we are likely to see signs of material deceleration in the two-quarter average revenue growth rate as well, with it expected to slip from 53.5% in fiscal Q2 2020 to 48.5% in fiscal Q3 2020. For Bill.com to avoid material deceleration, the company will need to report $46.1 million in revenue for fiscal Q4 2020, $2.2 million above the high end of current estimates. This is still an exceptional growth rate, but it's hard to justify paying up for a growth stock when material deceleration is on the horizon. At the current valuation, I would argue that Bill.com is priced for perfection here. For the company to avoid material deceleration, it will need to report $46.1 million in revenue for fiscal Q4 2020, $2.2 million above the high end of current estimates. To confirm that this is indeed a meaningful deceleration and not a one-quarter anomaly, I like to use two-quarter average for revenue growth rates, as it helps to smooth out any lumpy quarters. As the chart below shows, the two-quarter average revenue growth rate (white line) continues to sink, and is expected to plunge below the 50% level as of fiscal Q3 2020. Worse, we are likely to see signs of material deceleration in the two-quarter average revenue growth rate as well, with it likely to slip from 53.5% in fiscal Q2 2020 to 48.5% in fiscal Q3 2020. This is still an exceptional growth rate, but it's hard to justify paying up for a growth stock when material deceleration is on the horizon. At the current valuation, I would argue that Bill.com is priced for perfection here.
(Source: YCharts, Author's Chart)
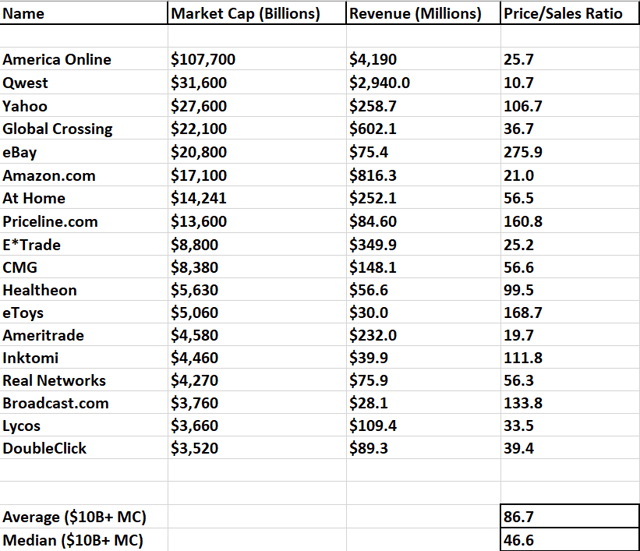
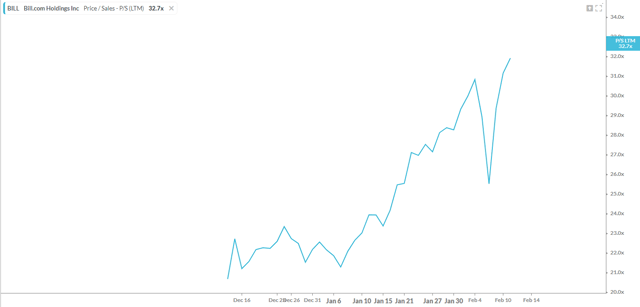
The table below shows a list of growth stocks from the end of Q2 1999 and their respective revenue multiples. As we can see, the median price-to-sales ratio just ahead of the Internet Mania was 46.6, and Bill.com is currently sitting at a price-to-sales ratio of 32.7. While this is not quite at the median for large-cap growth stocks heading into Q3 1999, it is above the price-to-sales ratio of America Online [AOL], Amazon (AMZN), E-Trade (ETFC), and just shy of the Lycos' [LYCOS] revenue multiple. Therefore, while Bill.com theoretically could have further to go from a valuation standpoint, things are indeed beginning to get a little frothy here short term.
(Source: Internet Bubble, Author's Chart)
(Source: Koyfin.com)
Based on the fact that Bill.com is trading at a revenue multiple higher than some names as they headed into Q3 1999, an investor is taking a substantial risk if they are buying at current levels above $63.00 per share. Given the fact that we are likely to see material deceleration on the horizon unless the company can put up gargantuan top line beats, it's even harder to justify paying a bubble-like valuation for a slowing growth story. Let's see if the technicals are also suggesting things are getting a little overheated.
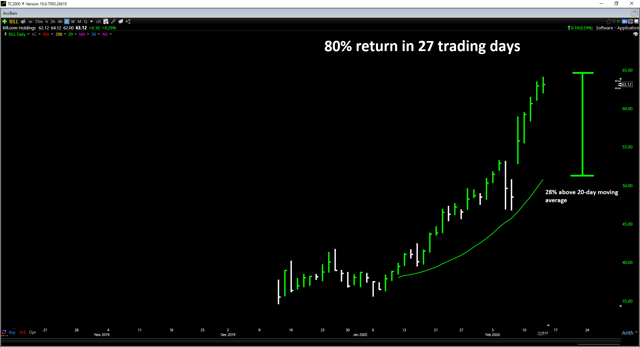
If we take a look at the daily chart below, we can see that Bill.com had officially gone parabolic, up 80% in 27 trading days, for an average daily gain over the period of over 2.9%. Besides, the stock is now nearly 30% above its 20-day moving average, with most growth stocks rarely trading more than 15% above this level for more than a day or two. Based on this, Bill.com is not only trading at a bubble-like valuation, but it's extremely extended short term. Of the 150 software stocks I track, it is the only one currently trading more than 25% above its 20-day moving average.
(Source: TC2000.com)
While Bill.com is undoubtedly an exciting growth stock worth keeping an eye on, I see the stock as high-risk at current levels. This is based on the fact that it has a high likelihood of material deceleration in the coming quarters, is valued richer than some stocks in Q3 1999, and is quite overbought short term. Based on this, I believe investors would be wise to stay on the sidelines here, and I would view any rallies above the $66.00 level before June as an opportunity to book some profits.
Disclosure: I/we have no positions in any stocks mentioned, and no plans to initiate any positions within the next 72 hours. I wrote this article myself, and it expresses my own opinions. I am not receiving compensation for it (other than from Seeking Alpha). I have no business relationship with any company whose stock is mentioned in this article.
Additional disclosure: Disclaimer: Taylor Dart is not a Registered Investment Advisor or Financial Planner. This writing is for informational purposes only. It does not constitute an offer to sell, a solicitation to buy, or a recommendation regarding any securities transaction. The information contained in this writing should not be construed as financial or investment advice on any subject matter. Taylor Dart expressly disclaims all liability in respect to actions taken based on any or all of the information on this writing.