US Dollar Index Price Analysis: Correction lower could test the mid-98.00s
by Pablo Piovano- The rally in DXY run out of some steam above the 99.00 mark.
- There is scope for the downside to extend to the 98.54 level.
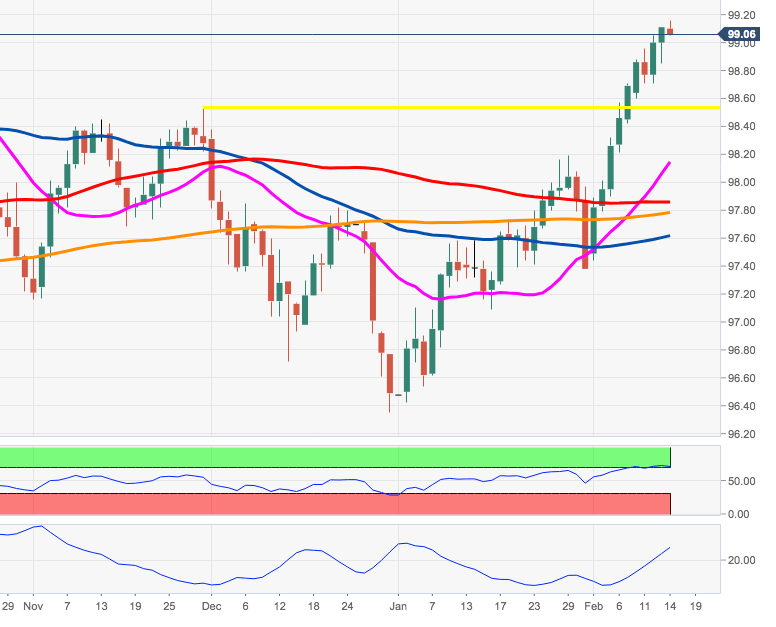
DXY is shedding some ground after reaching fresh yearly peaks in the proximity of 99.20 earlier on Friday.
The current overbought levels in the dollar coupled with the strong rally carry the potential to spark a correction lower to, initially, the November 2019 top at 98.54 in the near-term.
Looking at the broader picture, the constructive perspective on the dollar is seen unaltered as long as the 200-day SMA at 97.76 underpins.
DXY daily chart

Dollar Index Spot
| Overview | |
|---|---|
| Today last price | 99.07 |
| Today Daily Change | 11 |
| Today Daily Change % | -0.04 |
| Today daily open | 99.11 |
| Trends | |
|---|---|
| Daily SMA20 | 98.1 |
| Daily SMA50 | 97.59 |
| Daily SMA100 | 97.86 |
| Daily SMA200 | 97.77 |
| Levels | |
|---|---|
| Previous Daily High | 99.11 |
| Previous Daily Low | 98.85 |
| Previous Weekly High | 98.71 |
| Previous Weekly Low | 97.44 |
| Previous Monthly High | 98.19 |
| Previous Monthly Low | 96.42 |
| Daily Fibonacci 38.2% | 99.01 |
| Daily Fibonacci 61.8% | 98.95 |
| Daily Pivot Point S1 | 98.94 |
| Daily Pivot Point S2 | 98.76 |
| Daily Pivot Point S3 | 98.68 |
| Daily Pivot Point R1 | 99.2 |
| Daily Pivot Point R2 | 99.28 |
| Daily Pivot Point R3 | 99.46 |