The Bubble: Bigger, Fatter, Uglier
by Eric Parnell, CFASummary
- Reflecting on presidential debate proclamations past.
- What progress has been made in addressing the big, fat, ugly bubble identified in September 2016?
- What are the implications of the bigger, fatter, uglier bubble today?
Nearly four years ago, a Presidential candidate for the United States proclaimed the following during a televised debate.
“Now, look, we have the worst revival of an economy since the Great Depression. And believe me: We’re in a bubble right now. And the only thing that looks good is the stock market, but if you raise interest rates even a little bit, that’s going to come crashing down.
We are in a big, fat, ugly bubble. And we better be awfully careful. And we have a Fed that’s doing political things. This Janet Yellen of the Fed. The Fed is doing political—by keeping the interest rates at this level. And believe me: The day Obama goes off, and he leaves, and goes out to the golf course for the rest of his life to play golf, when they raise interest rates, you’re going to see some very bad things happen, because the Fed is not doing their job.”
--Donald Trump, Presidential Debate at Hofstra University, September 26, 2016
A bold proclamation indeed. And I strongly agreed with some of these sentiments expressed at the time. Specifically, while I held a different view in regard to the political motivations, I agreed that risk asset prices including the S&P 500 Index that closed at 2146 that day were artificially overinflated as a result of years of extraordinarily accommodative monetary policy from the U.S. Federal Reserve. I also agreed that the stock market would be highly vulnerable to any sustained increase in interest rates at some point in the future.
Of course, this candidate eventually prevailed in the 2016 election to become President of the United States. And given that we are now in the fourth year of the current administration, it is worthwhile to consider the progress that has been made in resolving this so called “big, fat, ugly bubble”.
"The worst revival of an economy since the Great Depression."
Let’s begin with an examination of the performance of the economic recovery both leading up to the debate in September 2016 and the period that has followed since. The U.S. economy reached its recessionary trough in 2009 Q2. Over the period that followed up to the time of this debate, the U.S. economy grew at a 2.2% annualized rate. Although the duration of the recovery at more than seven years that that point was long by historical standards, this was a relatively tepid pace of economic growth in recovering from what was one of the worst recessions in U.S. history.
So how has the U.S. economy performed since? Including the first reading on 2019 Q4 GDP that was released on Thursday, the U.S. economy has grown at a 2.5% annualized rate. This is certainly better than the 2.2% growth rate that preceded it, but only marginally so. And despite the fact that we are now in the longest sustained economic expansion in U.S. history, this recovery rate remains relatively slow as it was before.
So despite the proclamations of today’s “booming” U.S. economy, it is notable that it many respects it is doing no better now than it has been throughout the post crisis period. And it’s growth rate is on a gradual decelerating trend as we enter 2020.
"The only thing that looks good is the stock market, but if you raise interest rates even a little bit, that’s going to come crashing down."
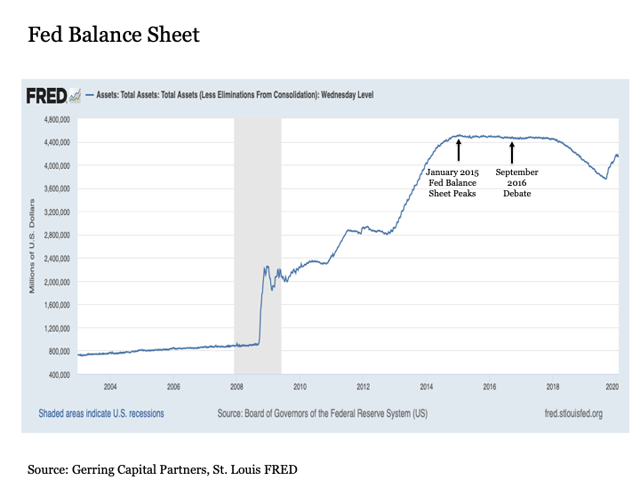
The U.S. Federal Reserve was already on track to tighten monetary policy when this debate took place in September 2016. The relentless expansion that roughly quintupled the Fed’s balance sheet in the wake of the financial crisis had already come to an end in January 2015. And the Fed even managed a quarter point rate hike in December 2015 before being forced to back off due to the spillover effects from an energy market that had been unraveling since 2014 with oil prices falling through the floor.
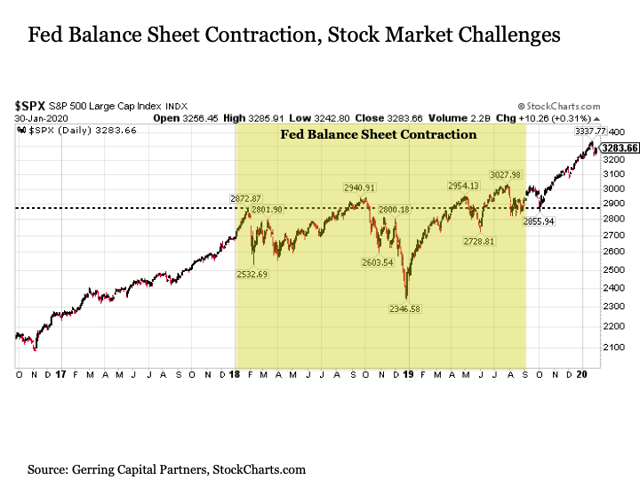
In the first two years that followed the September 2016 debate, the Fed was making great progress in achieving the seemingly improbable objective of tightening monetary policy without crashing the stock market. This included another eight quarter point interest rate hikes and a shrinking of the balance sheet by $700 billion from January 2018 to August 2019.

The stock market was not without its challenges during this time period, however. It traded effectively flat over this entire time period of more than a year and a half. This included a roughly -20% peak to trough decline in 2018 Q4 that included the worst market performance during the month of December nearly a century. It was during this sharp and precipitous stock market decline that all of the Fed’s interest rate normalization and balance sheet reduction plans were brought to an end despite the fact that the U.S. economy itself was largely unaffected both during and after this late 2018 spell. An unfortunate opportunity lost, for it may have been the last chance.

What have we seen since August 2019? The Fed has cut interest rates three times by a quarter point and has added more than $400 billion back on to its balance sheet. In the process, the U.S. stock market is once again back off to the races to the upside despite signs of an increasingly slowing economy and decelerating earnings growth. Got it.
"We have a Fed that’s doing political things."
To this I will only say the following. If a candidate had concerns that the Fed’s policy making was being influenced by politics prior to the 2016 election, then this same person would have done well to maintain silence about the actions of the Federal Reserve once assuming office. If it was perceived that the Fed was doing political things leading up to September 2016, such perceptions are vastly amplified when the leader of U.S. fiscal policy in the elected president is explicitly vocal in their views on how U.S. monetary policy should be administered while in office. The Fed is independent for a reason. And as Presidents Johnson and Nixon came to discover in the past, applying policy pressure on the Fed can lead to much greater unintended future consequences.
"We are in a big, fat, ugly bubble"
If we were in a big, fat, ugly bubble in September 2016, we are in an even bigger, fatter, uglier bubble today.

But I wouldn’t go so far as to characterize either then or today as a “bubble”. While stocks have certainly performed relentlessly well, they certainly do not have the same characteristics of widespread euphoria that existed during the tech bubble of the late 1990s.
Instead, I would describe what we have both in September 2016 and even more so today is unsustainable and distorted fundamental imbalances that will eventually need to be resolved at some point in the future. And much like a rubber band on a sling shot, the longer and more these fundamental imbalances are extended, the more pronounced the subsequent resolution is likely to be. Not a sudden bubble bursting in a handful of months like 2008-09, however. But instead a long and painfully slow unwind of risk assets (and not necessarily the underlying economy) lasting over a few years.
Consider the following:
In September 2016, the amount of public debt as a percentage of GDP was an alarmingly high 104%. Today it is even higher at 106%.
Total public debt in September 2016 was $19.6 trillion. Today it is more than $3 trillion higher at $22.7 trillion.
The Federal budget deficit in 2016 was $585 billion and just over 3% of U.S. GDP. In 2019, it was nearly double this amount at $1.092 trillion and at roughly 5% of U.S. GDP.
In September 2016, NYSE margin debt was $540 billion. Today it is even higher at $579 billion after having peaked at a record $668 billion in mid-2018 leading into the 2018 Q4 market turbulence.
And in terms of stock valuations, the S&P 500 Index in September 2016 was trading at 24.3 times trailing 12-month GAAP earnings. Today, it is trading at 25.1 times earnings. And this is with the benefit of the major corporate tax cut at the end of 2017 that was supposed to spark an accelerated growth rate that has largely failed to materialize to date. If corporations were paying the same tax rate today that they were in September 2016, the S&P 500 would be trading at an even loftier 27.1 times earnings.
If it’s a bubble, its bigger, fatter, and uglier today than it was in September 2016. Unfortunate.
"You’re going to see some very bad things happen"
While the stock market party rages on today and is likely to continue doing so as long as the Fed liquidity is still flowing, unfortunately in the end I think this one time presidential candidate will ultimately be proven right.
We’re very likely going to see some very bad things happen.
Perhaps it will come when Trump has gone out to the golf course to play a round with Obama.
Perhaps it will be sooner.
Only time, the next U.S. economic recession, the direction of the Fed’s balance sheet, and the pace of corporate stock buybacks will tell.
Stay tuned. And be prepared with a balanced portfolio allocation across a broad range of uncorrelated asset classes that includes today’s still popular U.S. stocks in the mix.
Disclosure: This article is for information purposes only. There are risks involved with investing including loss of principal. Gerring Capital Partners and Global Macro Research makes no explicit or implicit guarantee with respect to performance or the outcome of any investment or projections made. There is no guarantee that the goals of the strategies discussed by Gerring Capital Partners and Global Macro Research will be met.
After years of policy stimulus since the financial crisis, stocks are trading at record high valuations and bond yields are at historic lows. Already in the longest expansion and bull market in history, it is only a matter of time before reality returns to global capital markets. Do you have a plan to continue participating in today’s bull market while also positioning for the next bear market? Come join us on Global Macro Research, where we apply a contrarian investment approach in preparing for risk in the future while positioning for opportunity today.
Disclosure: I am/we are long USMV,SPLV. I wrote this article myself, and it expresses my own opinions. I am not receiving compensation for it (other than from Seeking Alpha). I have no business relationship with any company whose stock is mentioned in this article.
Additional disclosure: I am long selected individual stocks as part of a broad asset allocation strategy.