How to Trade Boeing Stock After Its Nasty Earnings Report
The stock popped, but bears control the land. Don't bet against them yet.
Boeing (NYSE:BA) unveiled its latest earnings numbers and the loss was a doozy. We’ll briefly break down the numbers and provide some ideas on how to trade Boeing stock now that the event is in the rear-view mirror.

Typically earnings reports boost a stock’s volatility. Once the curtain is pulled back and the numbers revealed, the market instantly reprices the shares to reflect what it deems to be a fair value in light of the new information. The jaw-dropping move in Amazon (NASDAQ:AMZN) last night is a perfect example of this type of fireworks.
What’s interesting about Boeing’s action this week is it barely budged, despite the fact that the company reported an unexpected loss for the quarter. For the three-month period, revenue came in at $17.9 billion versus $21.7 billion expected. The underwhelming sales resulted in an adjusted earnings per share loss of $2.33, falling well below analyst forecasts of a $1.30 gain for the quarter.
But, as I said, the stock shrugged. By Wednesday’s close, it rallied 1.7%. So many twists and turns in the ongoing 737 Max debacle have developed each month that the once-exciting earnings moves have become boring.
BA Stock Charts
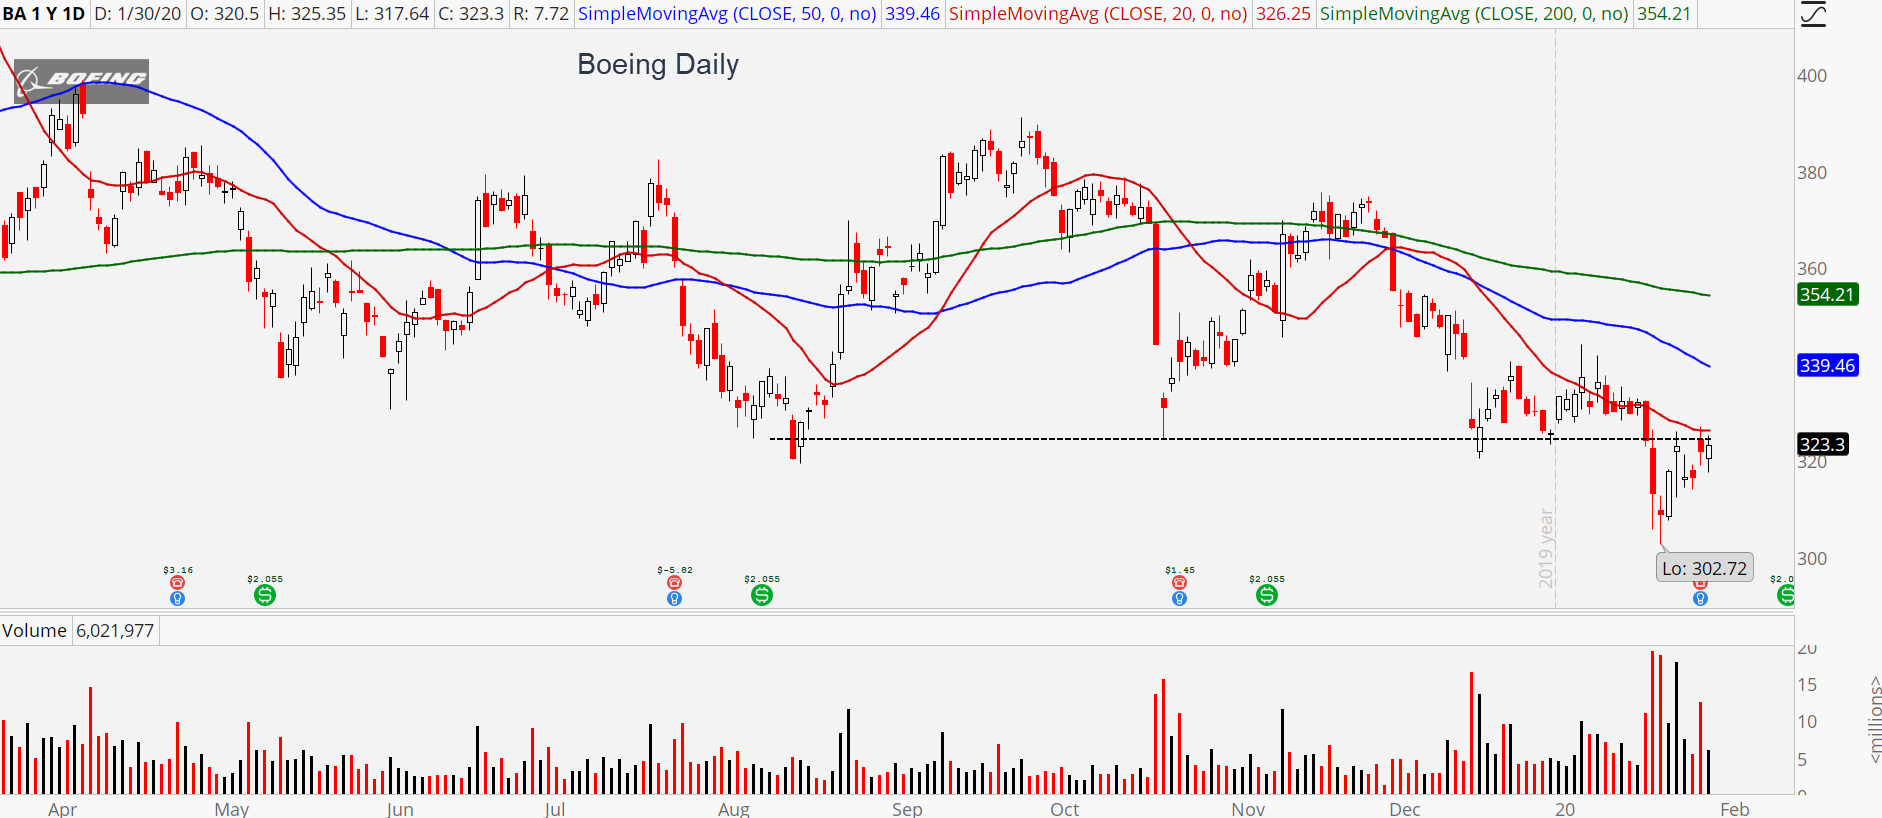
With the muted earnings reaction, Boeing’s chart exited the event identical to the way it entered. That is, bearish, volatile and any other negative sounding thing you’d like to add. Optimists will point toward the stock standing firm in the face of disappointing numbers. It’s a fair point. The market could have clung to the unexpected loss and smashed BA back down to last week’s lows near $300.

But it didn’t. And that should provide some short-term hope. And I do stress the “short-term” part of that sentence. To get anything going on the upside, BA stock needs to return to the north side of its moving average. The 20-day would be a nice start, but it will take a breach of the 50-day and 200-day to really bring big buyers to the yard. Until then, I remain skeptical and thus a seller into any strength. Right now it’s chipping away at old support (now new resistance) at $325. That’s the first ceiling that needs smashing.

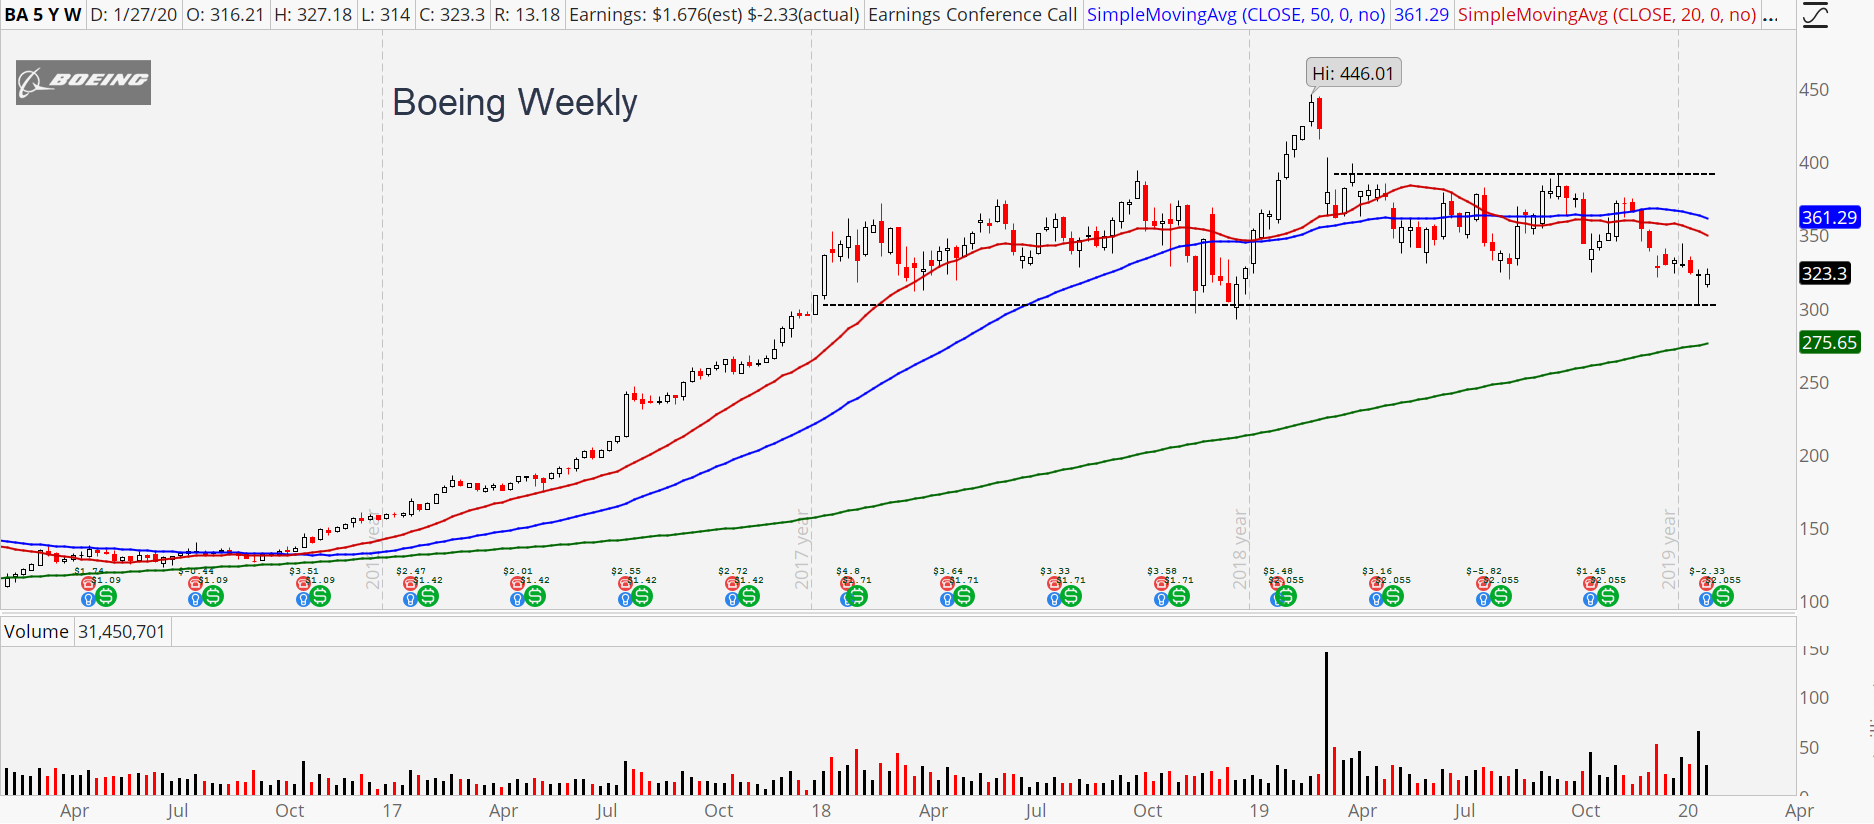
One more bullish item on the weekly time frame is the stock’s current position at the lower end of its two-year range. Buyers emerged to defend support at $300 last week. If it continues to hold, this is as logical an area as any for some type of bottom to form. As I said though, until we see upside follow through on the daily chart, bulls need to stay nimble.
Volatility and Trades
On the implied volatility front, we’ve seen a fairly substantial crush after earnings, shrinking the payout of short premium strategies like credit spreads, condors and the like. If you were hoping to bottom fish with bull puts to create a high probability of profit, the conditions aren’t great.
I’d rather wait for more evidence before joining buyers myself. There’s too much overhead resistance to contend with. My best idea is waiting for downside confirmation (such as a break of yesterday’s low of $317.64), and then buy bear puts for a push to $300.
The March $320/$300 bear put should do the trick. It currently trades for approximately $6.75 but will be a bit more expensive if you wait for the trigger.
As of this writing, Tyler Craig didn’t hold positions in any of the aforementioned securities. For a free trial to the best trading community on the planet and Tyler’s current home, click here!