The Next AMD Stock Buy Opportunity is Coming … Just Not Yet
Advanced Micro Devices still looks good, post earnings, but don’t discount an inevitable correction
A mixed earnings package leads to hard profit-taking in Advanced Micro Devices (NASDAQ:AMD). But for investors convinced the next buying opportunity in AMD stock is here, think or better yet — look again. Let me explain.

It was quite the year for AMD stock investors as 2019 saw shares surge higher from $18.46 to $45.86 for a commanding market-beating return of nearly 150%. That compares favorably to the NASDAQ’s 37% gain and other closely watched chip names such as Intel’s (NASDAQ:INTC) lagging but solid 30% climb or Nvidia’s (NASDAQ:NVDA) standout 73% gain.
The fun for Advanced Micro Devices bulls didn’t end with the Times Square ball drop, either. Out the gate in 2020, the momentum continued to push shares up another 15%, forging new all-time-highs for the first time since 2000. Then came earnings.
Hyper stock gains, high expectations and a solid-but-mixed quarterly report yielded a combination easily plied into profit-taking with AMD tumbling as much as 9% on Wednesday before closing down a still stiff 6%.
By the numbers, Advanced Micro Devices reported a profit of 32 cents per share compared to estimates of 31 cents. The penny beat couldn’t have been any tighter. Likewise, sales also squeaked past views on revenues of $2.13 billion versus Street forecasts of $2.11 billion for AMD stock.
Mixed Guidance
The company’s narrow top- and bottom-line beats may have proved enough for some investors to pause and lock in obviously terrific gains in AMD stock despite a bevy of new and well-received chips and graphics cards helping grow sales in 2019 by a forceful 50% year-over-year.
For those needing additional reasons to scale back stock exposure, the semiconductor outfit did issue mixed guidance. Then again, with a modest below-views Q1 sales outlook trumped by a more forceful, above-views full-year growth forecast of 28-30%, maybe Wednesday’s profit-taking was simply all about the AMD stock chart? Let’s have a look.
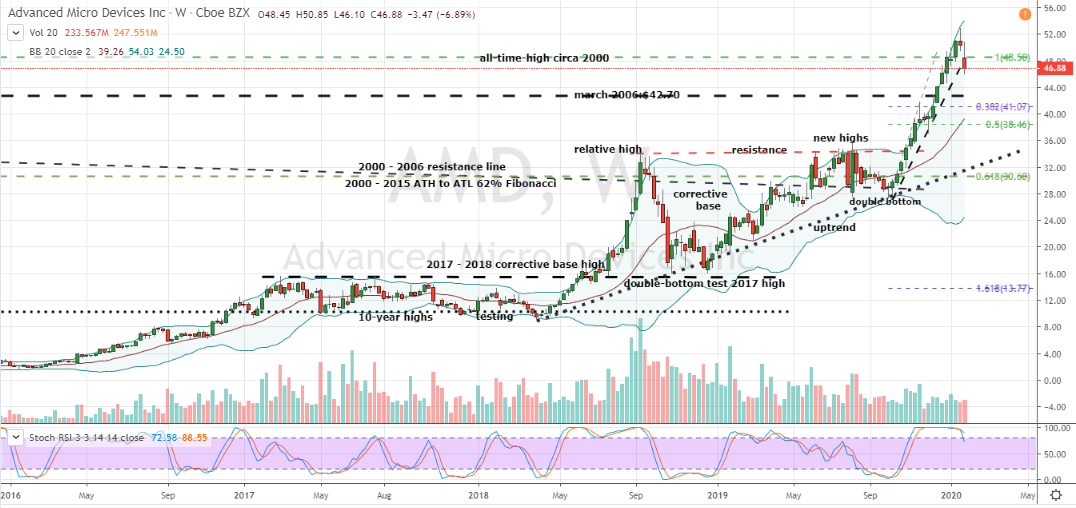
AMD Stock Weekly Chart
Before investors — still rightfully upbeat on AMD stock’s prospects — grow too excited, it’s best to look past the daily price chart. It’s our observation an alluring oversold hammer pattern formed on top of Bollinger Band support, is likely to fail. And if we pan out to a larger time-frame, it’s easy to see why.

Source: Charts by TradingView
As good as 2019 was to AMD stock investors, shares have been rewarding and enriching bulls for four full years. Over that period shares have surged from roughly $1.50 in price to produce a staggering return in excess of 3,000%. What’s more, both the provided weekly and monthly charts are offering sure signs the stock’s rally is due for a more meaningful corrective period.
Bottom-line, with AMD stock having confirmed an overbought topping pattern on the weekly chart, a run-of-the-mill correction for a growth name of Advanced Micro’s caliber should be expected. And if that tendency holds true, investors should be prepared to see a decline of 20-30% before conditions become more attractive for buying on weakness.
Disclosure: Investment accounts under Christopher Tyler’s management currently and continue to own positions in Advanced Micro Devices (AMD) and its derivatives, but no other securities mentioned in this article. The information offered is based upon Christopher Tyler’s observations and strictly intended for educational purposes only; the use of which is the responsibility of the individual. For additional options-based strategies, related musings or to ask a question, you can find and follow Chris on Twitter @Options_CAT and StockTwits.