CryptoPotato News (Official)
Bitcoin Price Analysis: $10,000 In Sight, However Bearish Divergence Might Ruin The Bulls Party?
by Yuval GovSince Bitcoin broke firmly above the $9K price line last Tuesday, we saw the coin consolidating mostly inside the range of $9300 – $9400.
The beautiful thing about Bitcoin is that its volatility will ever stay. It doesn’t really matter whether Bitcoin price is trading for $10, $100, or $9000.
Yesterday we saw another volatile move a-la Bitcoin: in under 30 minutes, we saw Bitcoin dropping from $9450 to $9000, only to mark a new yearly high at $9570 not so long after.
The day traders who had kept their positions with stop-loss commands in that region were very unhappy to find their position liquidated in loss following this mini flash-crush.
As a reminder, the $9550 was mentioned by us on the previous price analysis as the next level of resistance above $9400.
Bullish, But Be Careful
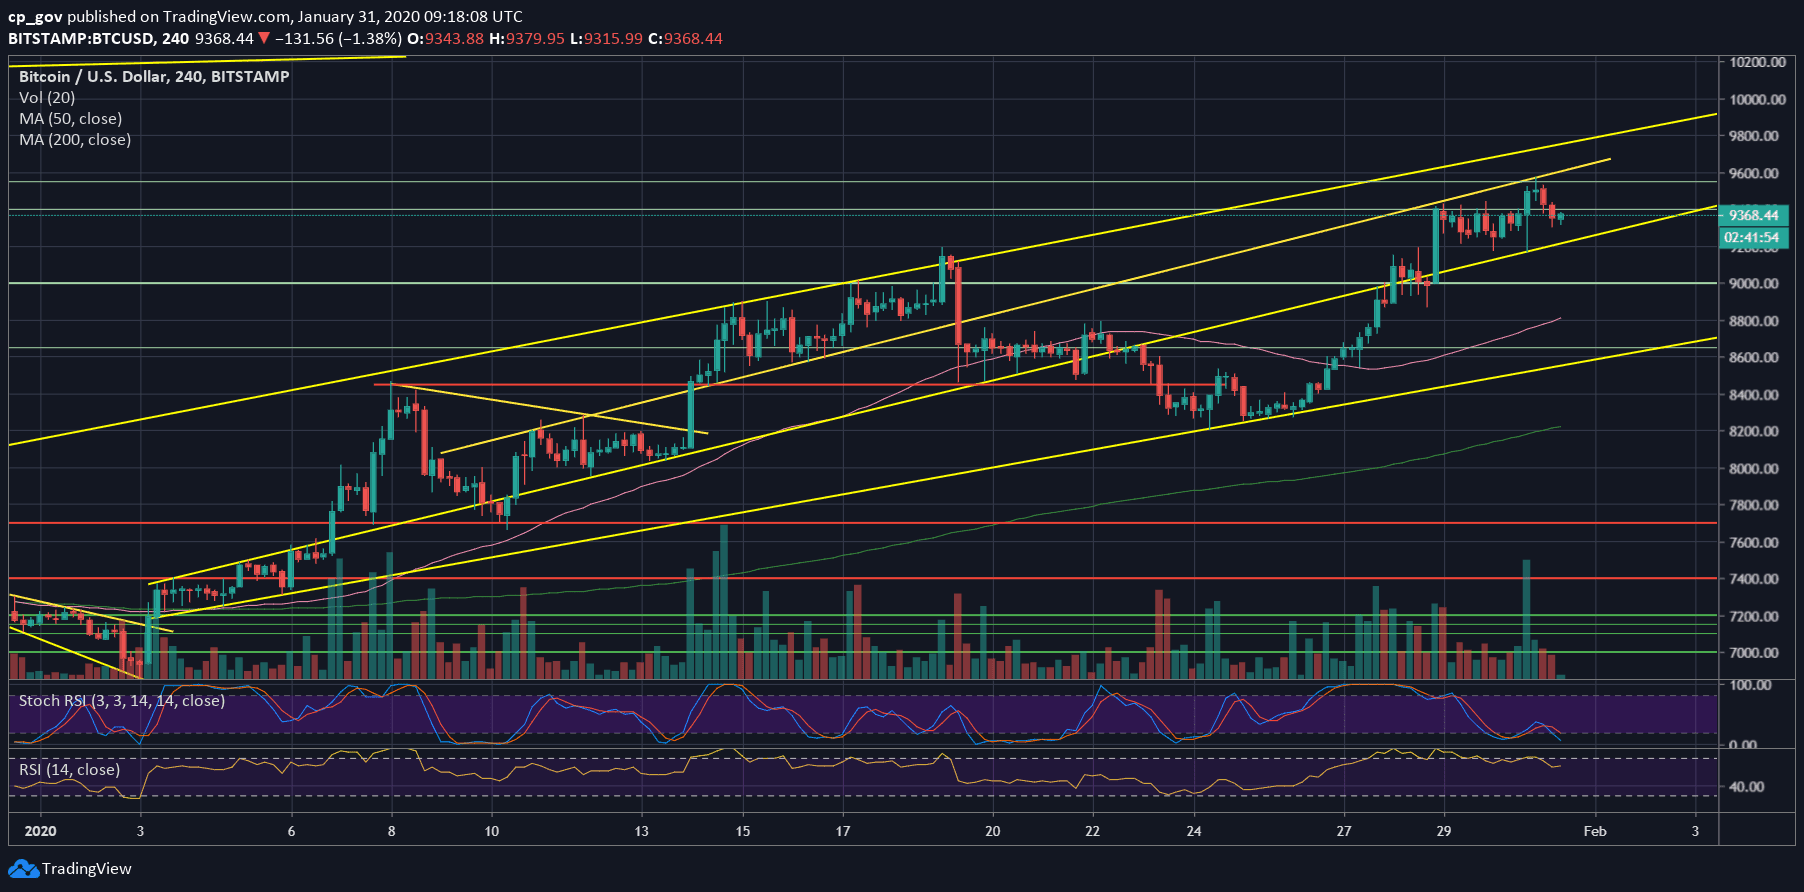
Bitcoin’s recent price action is respecting the ascending channel on the 4-hour chart below. As can be seen, yesterday’s low of $9170 (Bitstamp) reached down precisely to the supporting line.
The overall picture is bullish; however, some signs suggest that Bitcoin might need to visit lower areas in the short-term, before continuation further above.
Total Market Cap: $258 billion
Bitcoin Market Cap: $170 billion
BTC Dominance Index: 66.0%
*Data by CoinGecko
Key Levels To Watch & Next Targets
– Support/Resistance levels: Bitcoin is now back at the confluence zone between $9300 – $9400. The first level of resistance lies at the yearly high at around $9550.
Further above lies the resistance area of $9700 – $9800, which includes the top boundary of our marked ascending price channel (marked on the following 4-hour chart). Higher above lies $10,000 and $10,300.
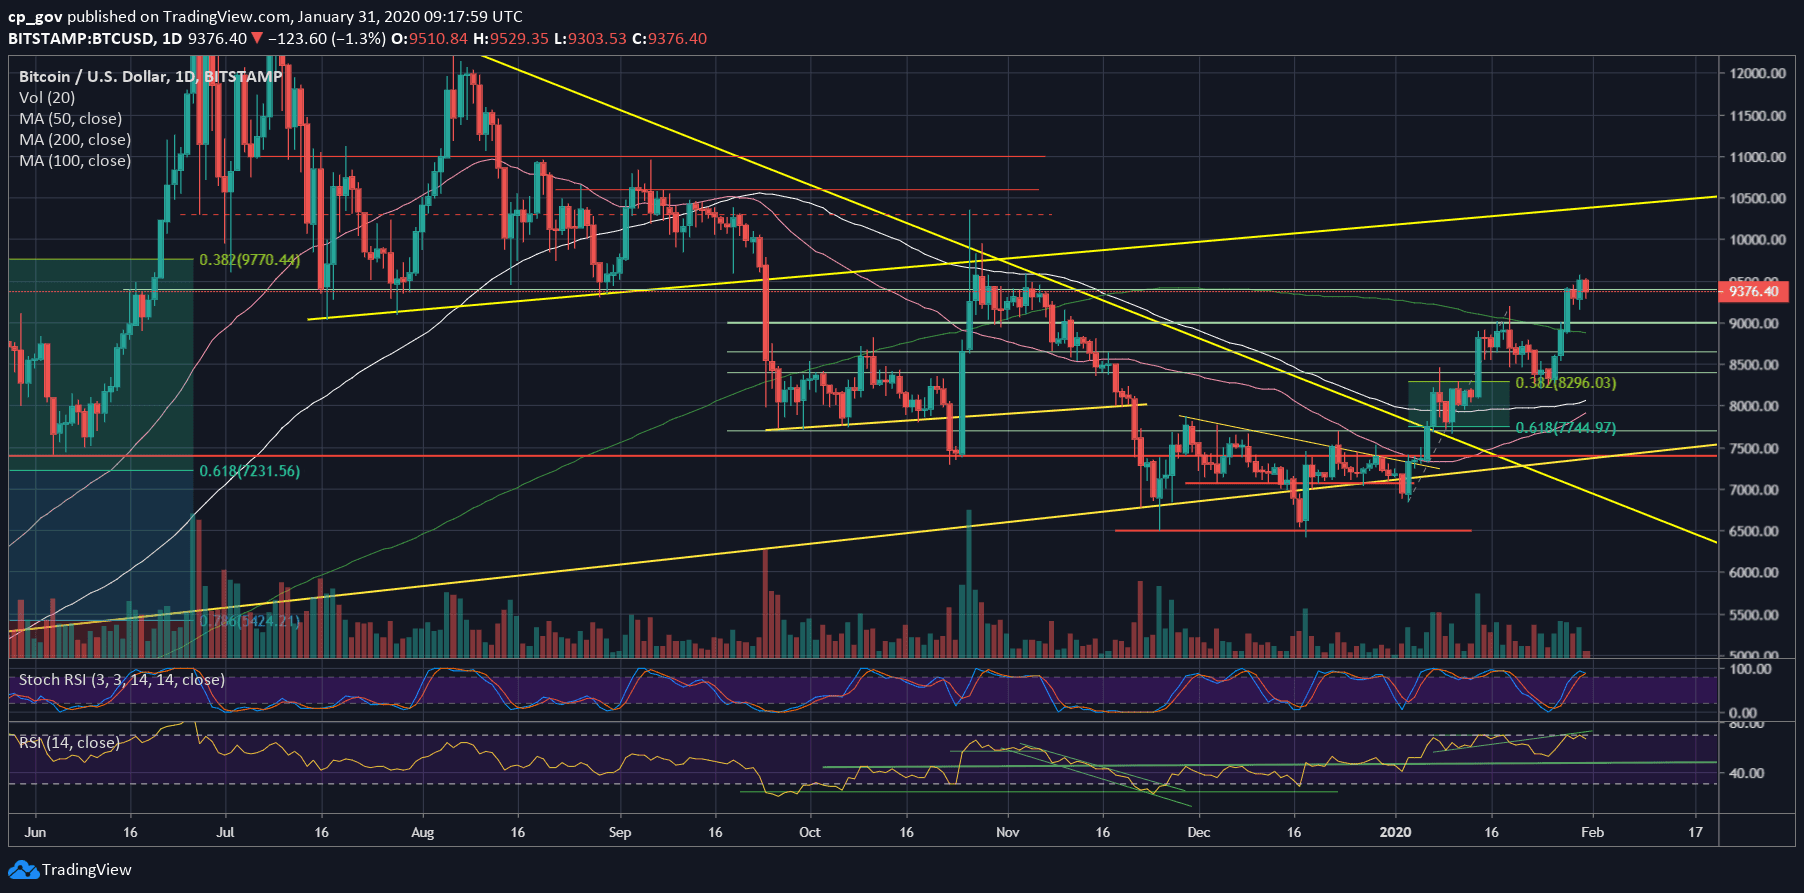
In the likely event of a correction, then the first level of support is the marked ascending trend-line on the 4-hour line (~$9280). Down below lies $9200 before the $9000 benchmark. Further down lies the significant 200-days moving average line, roughly around $8850.
– The RSI Indicator: As mentioned in the previous price analysis, the momentum indicator had failed to breach the short-term ascending trend-line, together with the 71-72 RSI levels. This had resulted in a bearish divergence that supports the idea of a possible correction.
Besides, the Stochastic RSI oscillator is about to make a bearish crossover at the overbought area. This also supports the correction option in case the crossover is made.
– Trading volume: The volume levels had started to increase over the past days, which is a bullish sign supporting the longer-term bullish trend.
BTC/USD BitStamp 4-Hour Chart

BTC/USD BitStamp 1-Day Chart

Click here to start trading on BitMEX exchange and receive 10% discount on fees for 6 months.
Disclaimer: Information found on CryptoPotato is those of writers quoted. It does not represent the opinions of CryptoPotato on whether to buy, sell, or hold any investments. You are advised to conduct your own research before making any investment decisions. Use provided information at your own risk. See Disclaimer for more information.
Cryptocurrency charts by TradingView.
Read more on: Bitcoin (BTC) Price