Retirement Target Date Allocation Glide Path In-Depth View
by Richard ShawSummary
- Allocation between OWN, LOAN and RESERVE Super Classes will determine the bulk of your investment returns.
- Age or retirement target date Allocation Glide Path provides guide to OWN and LOAN allocation over time.
- Allocation Glide Paths are for "typical" investors, not everybody, and other sources of retirement income need to be considered in the allocation decision.
- Focus on three leading Target Date fund sponsors: Vanguard, Fidelity and T. Rowe Price.
We have talked about allocation glide path before, but let’s look at it with additional detail.
First and foremost, remember that your portfolio return will be most significantly determined by your choice of allocation between the three super classes (OWN, LOAN, RESERVE). While some target date funds hold some cash (RESERVE), their allocations are overwhelmingly between OWN and LOAN.
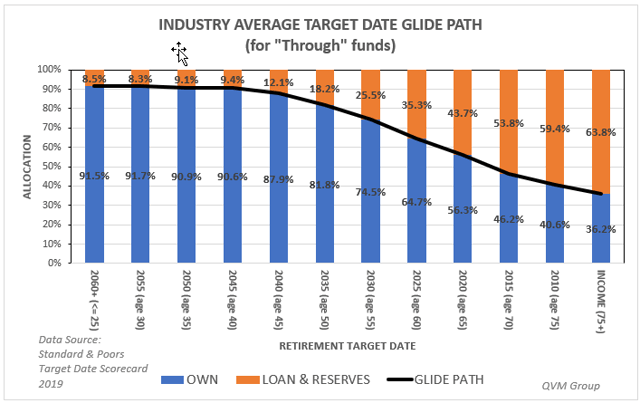
Standard & Poor’s analyzed the portfolio allocations of the target date fund industry for “Through” funds.
“Through” funds continue to annually adjust the portfolio after the target date, whereas “To” funds stop adjusting portfolio allocation once they reach the target date allocation.
The results of that study are shown in this graphic, indicating that even at the youngest ages, a small amount of LOAN is superior to 100% OWN; and that after about age 40 the percentage allocated to LOAN should increase until reaching almost 65% sometime in investor age mid-70s (assuming retirement began at age 65).
Target date funds, or portfolio allocations like target date funds, are not for everybody. They assume a typical investor, who in retirement years has no sources of income other than the portfolio and Social Security; and whose portfolio is adequate but not strongly overfunded. Let’s now take the view of these allocations further.
If the assumption is that in retirement there are no income sources other than the portfolio and Social Security, then let’s see how we might envision a portfolio allocation if there are additional sources of income.
If a retiree has a pension or some other source of passive income, how should we factor that into the allocation? One possibility is to conceptually consider it to be like bond (LOAN) income, and to capitalize it to represent a notional bond position. In other words, $100,000 of passive income capitalized at an assumed bond yield of 4% would resemble a notional bond position of $2.5 million ($100,000 divided by 4%).
This table converts the concept into a notional LOAN allocation within the actual plus notional assets.
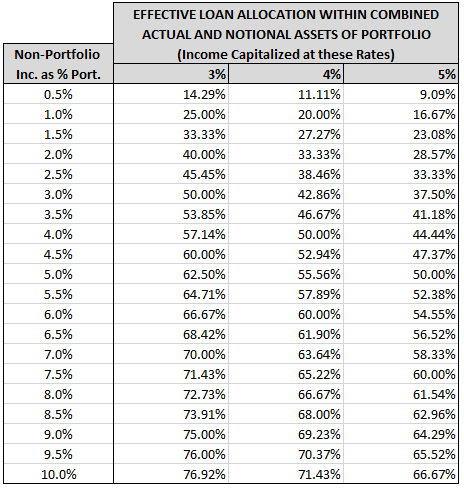
Look at the second line of the table.
If a retiree had a passive income equal to 1% of the actual portfolio and if 4% were a reasonable bond yield expectation, then that income might be considered as the equivalent of about 20% of the combined actual and notional portfolio.
Putting that in dollar terms, if the retiree had a $1 million portfolio and a $10,000 passive income source, the retiree might consider that passive income to be roughly equivalent to a $250,000 bond position.
That would make the actual plus notional portfolio equal to $1.25 million, with the notional portion being equal to 20%.
If the glide path called for a 64% LOAN allocation and 20% was satisfied notionally by the passive income, then conceptually it might be reasonable to assume that only 44% of the actual plus notional portfolio ($550,000) would need to be allocated to LOAN within the actual portfolio, rationally allowing $450,000 to be allocated to OWN instead of $360,000 (36%) within the actual portfolio.
Certainly, arguments can be made against this approach (e.g. you can’t consume the notional LOAN principal), but I don’t think it’s crazy.
That is how I think of my own portfolio. While I am not drawing on it for income, I try to manage it as if I was, and since I have a corporate pension, I consider that to be a notional bond position. Because I am not entirely confident about the future payments from that pension, I capitalize it at a rate comparable to a junk-bond instead of that of an investment grade bond.
Now back to target date funds and the allocations they suggest.
The three dominant retirement target date fund sponsors are Vanguard, Fidelity, and T. Rowe Price. I like to focus on what they think, as opposed to an undisclosed universe of target date funds. There are about 10 meaningful players in the field but looking at these three covers most of the assets under management, and I have confidence in the breadth, depth, and expertise of their allocation recommendations.
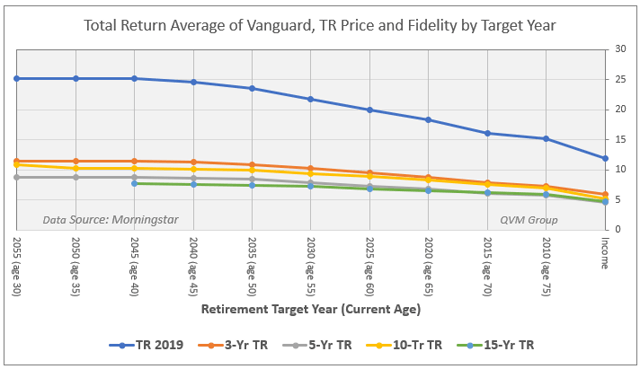
So how have these allocations worked out? Taking the average of the target date funds for each target year for the three sponsors, this chart shows the 2019, 3-year, 5-year, 10-year, and 15-year total return for each of the target date fund averages.
You see a declining total return after age 40, because there is a lower OWN and larger LOAN allocation.
It is useful to note how Vanguard, Fidelity and T. Rowe Price differ after the age 65 target date.
When Vanguard reaches the age 65 target date, it continues its glide path “through” the next 7 years, and then merges the fund with their “income” fund.
When Fidelity reaches the age 65 target date with a higher OWN allocation than Vanguard, it continues its glide path “through” the next 19 years before merging the fund with their “income” fund.
When T. Rowe Price reaches the age 65 target date, it continues its glide path “through” the next 30 years (effectively to age 95) and does not merge with an “income “fund.
The next chart shows the maximum drawdown for each of the funds offered by the three sponsors for each target date since the stock market bottom in March 2009.
While declining total returns as target dates get closer to retirement age are not attractive, the declining size of maximum drawdowns as target dates move closer to and into retirement are attractive. In fact, the reason, in great part, for the change in allocation is to minimize maximum drawdowns
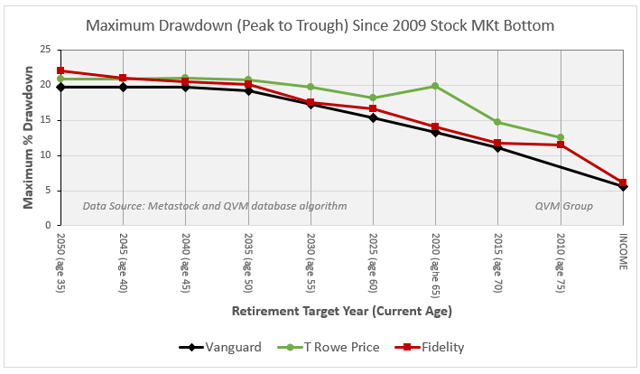
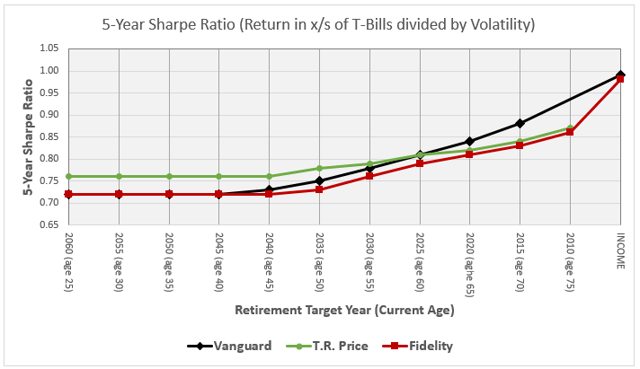
The reduction in maximum drawdowns corresponds to the improved Sharpe Ratio of the allocations containing more LOAN. Sharpe Ratio is the total return in excess of T-bill returns divided by the volatility.
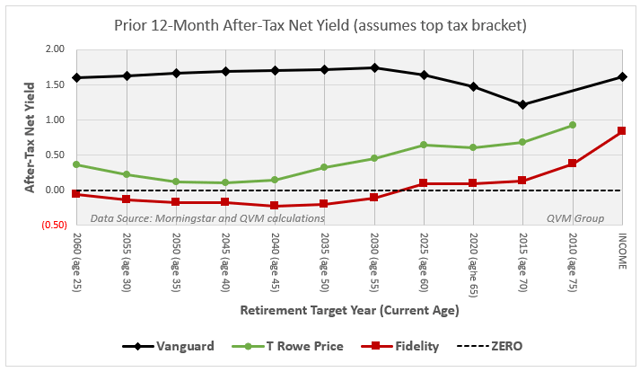
Now let’s look at portfolio yield - not the gross yield, but the yield after taxes on the yield. This chart shows the after-tax yield of the target date funds for each of the three sponsors for the preceding 12 months.
The tax calculations by MorningStar are based upon federal tax at the maximum marginal rate without consideration of state taxes.
I am not aware of the reason for the decline in net yield for Vanguard between target age 60 and 70 – is it a 2019 anomaly, an error in the MorningStar database, or intentional – I don’t know.
With Fidelity and T. Rowe Price you see a rising level of net yield in the pre-retirement and retirement years.
Even though Vanguard had a decline in net yield for the pre-retirement and early retirement target date funds, the net yield from Vanguard was higher than that for Fidelity and T. Rowe Price for all target dates.
In fact, Fidelity produced a negative after-tax yield for all target dates from 2060 to 2030.
My personal preference is to have after-tax positive yield on investments and would not be comfortable having to pay the government more than the fund paid me. In retirement I would want a larger share of total return coming from yield than from capital appreciation. Therefore, in my opinion Vanguard is the best choice in this dimension.
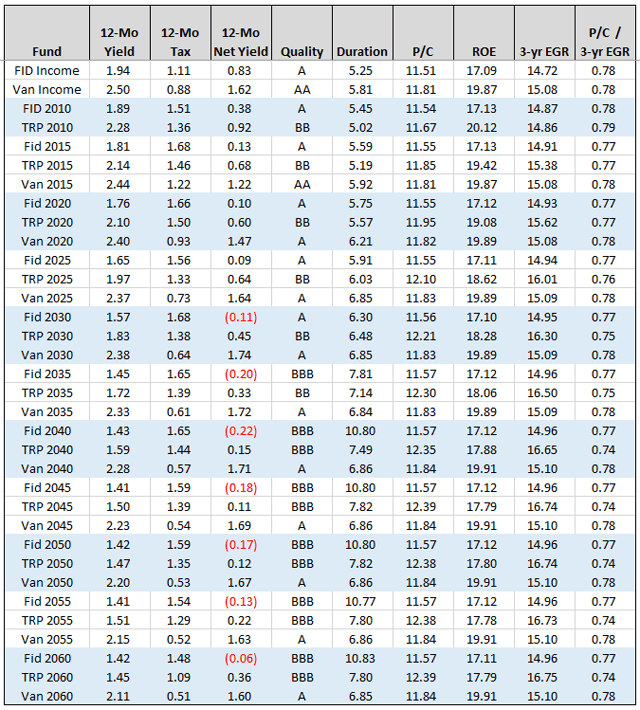
This table provides fundamental information about the funds which is also useful, particularly as it relates to credit quality of the LOAN allocation.
The average quality of bonds in the Vanguard funds is A for all target dates and is AA for their “income” fund.
The average quality of bonds for Fidelity and T. Rowe Price is BBB for those in younger years. By retirement age 55, Fidelity upgrades credit quality to A.
In contrast, T. Rowe Price downgrades LOAN quality from BBB to BB (junk quality) at retirement age 50 and remains there through at least the 2010 target date. I don’t understand why T. Rowe Price would increase credit risk for older investors. Higher yield, Yes, but also higher maximum drawdown risk, as high yield bonds have a higher correlation to stock returns and drawdowns.
Based on this information, I view Vanguard as the best choice, and T. Rowe Price as the worst choice.
Having some of the portfolio in a Vanguard target date fund might be appropriate for some people; and considering the glide path arguments embedded in target date funds, I believe, is appropriate for everyone. For reference, in case you would like to do any of your own further examination of any of the funds, the symbols for the target date funds for Vanguard, Fidelity and T. Rowe Price are as follows:
| Target Date | SYMBOL | ||
| (implied age) | Vanguard | Fidelity | T.R. Price |
| 2060+ (<= 25) | VTTSX | FDKVX | TRRLX |
| 2055 (age 30) | VFFVX | FDEEX | TRRNX |
| 2050 (age 35) | VFIFX | FFFHX | TRRMX |
| 2045 (age 40) | VTIVX | FFFGX | TRRKX |
| 2040 (age 45) | VFORX | FFFFX | TRRDX |
| 2035 (age 50) | VTTHX | FFTHX | TRRJX |
| 2030 (age 55) | VTHRX | FFFEX | TRRCX |
| 2025 (age 60) | VTTVX | FFTWX | TRRHX |
| 2020 (age 65) | VTWNX | FFFDX | TRRGX |
| 2015 (age 70) | VTXVX | FFVFX | TRRBX |
| 2010 (age 75) | --- | FFFCX | TRRAX |
| INCOME (75+) | VTINX | FFFAX | --- |
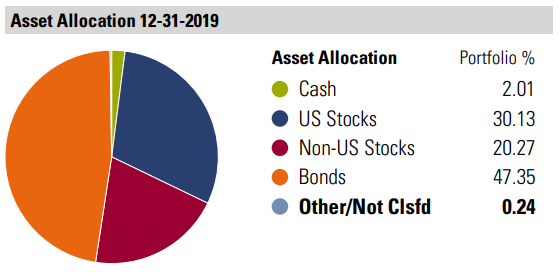
For those of you retiring now, this is what the Vanguard 2020 portfolio looks like in a pie chart:
If you have a Bond Market Survival Ladder, which we have discussed before and will review again in a future letter, it may be reasonable for you to have a higher OWN allocation than would be indicated by these glide paths. That is because you can consume the ladder and portfolio income during a bear market without having to sell assets at depressed prices to generate the cash you need in retirement.
Disclosure: QVM has positions in some of the securities identified in this article as of the publication date. We certify that except as cited herein, this is our work product. We received no compensation or other inducement from any party to produce this article, and are not compensated by Seeking Alpha in any way relating to this article.
General Disclaimer: This article provides opinions and information, but does not contain recommendations or personal investment advice to any specific person for any particular purpose. Do your own research or obtain suitable personal advice. You are responsible for your own investment decisions. This article is presented subject to our full disclaimer found on the QVM site available here -- https://qvminvest.com/disclaimer-for-all-posts.