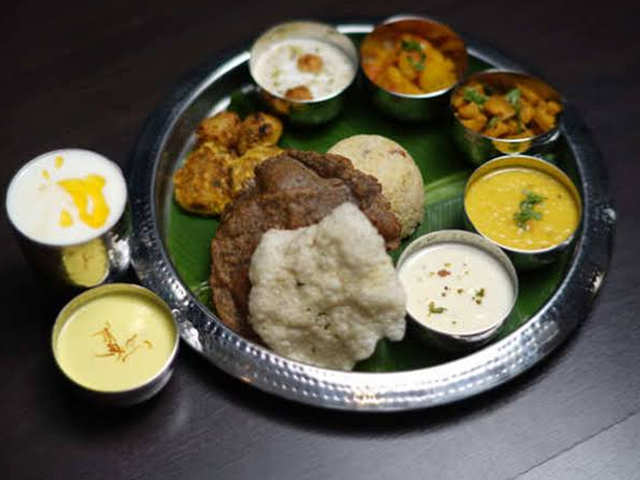
Eco Survey: Thalinomics in times of rising prices: Veg, non-veg thalis more affordable
Using the annual earnings of an average industrial worker, it is found that affordability of vegetarian thalis improved 29 per cent from 2006-07 to 2019-20 while that for non-vegetarian thalis improved by 18 per cent.
by Yogima Sharma
New Delhi: The affordability of a vegetarian thali improved by 29% between 2006-07 and 2019-20 and that of a non-vegetarian thali by 18% over the 13-year period, according to the survey.
The survey has used the thali – a plate of food – as an example of something that people encounter every day in an attempt to make economics relate to the common person.
Jharkhand topped the list of states with the most affordable thalis in both categories in April-October 2019. Two vegetarian thalis for a household of five in Jharkhand required about 25% of a worker’s daily wage, according to the survey.
The survey analysed data from the Consumer Price Index for industrial workers for about 80 centres in 25 states/ Union Territories from April 2006 to October 2019 to arrive at the cost of a thali as part of ‘Thalinomics.’ Using the annual earnings of an average industrial worker, the survey calculated that a vegetarian household saved Rs 10,887 on an average per year, assuming five individuals had two thalis a day, while households eating non-vegetarian thalis saved Rs 11,878 a year.
“Both across India and the four regions – North, South, East and West – we find that the absolute prices of a vegetarian thali have decreased since 2015-16 though it increased during 2019,” it said. “This is owing to significant moderation in the prices of vegetables and dal from 2015-16 when compared to the previous trend of increasing prices.”

According to the survey, many reform measures were introduced since 2014-15 to enhance productivity of the agricultural sector as well as efficiency and effectiveness of agricultural markets for better and more transparent price discovery.
Food inflation based on Consumer Food Price Index declined to a low of 0.1% in 2018-19 against 1.8% in 2017-18, 4.2% in 2016-17 and 4.9% in 2015-16. However, the government revised the inflation projection from 3.5-3.7% in the second half of 2019-20 to 4.7-5.1%.
“Though everyone knows food inflation has fallen in the last few years, the Survey has put it in the context of overall household savings, which is relevant as it is a significant amount for a low-income family,” said Bidisha Ganguly, chief economist at Confederation of Indian Industry.
After 2015-16, there was an average gain of around Rs 3 per vegetarian thali at the all-India level (Rs 0.1 in 2016-17, Rs 2.8 in 2017-18, Rs 4.6 in 2018-19 and Rs 4.4 in 2019-20), resulting in an average yearly gain, in nominal terms, to about Rs 10,887. The gain is, on average, 6.5% of an individual worker’s yearly wages. For a non-vegetarian thali, the gain was Rs 1.8 in 2016-17, Rs 2.4 in 2017-18, Rs 4.5 in 2018-19 and Rs 4.2 in 2019-20, resulting in an average yearly gain of about Rs 11,787.