Q4 GDP: A Quick First Look
by Trading Places ResearchSummary
- Quarterly real GDP growth came in slightly hotter than I expected at 2.1%.
- The single-biggest mover was the total collapse in real imports, down 8.7%.
- Consumption is way down. Real core PCE growth was 2.1%, well below the 4+% we need to reach 3% real GDP growth.
- Outside of residential construction and IP, investment is cratering. There was destocking on top of that.
- Income and wage growth are tapering a bit. Inflation remains muted.
This is a quick first take on today’s 2019 Q4 GDP report. I will have a full review early next week.
A Slow Trudge Is The Best Case
That subject heading was the title of my Q3 GDP review, and what we see in today’s GDP report is more of the same. Real GDP growth came in at 2.1% annualized QoQ and 2.3% in the full-year window.
I think it could go to 4, 5, and maybe even 6%, ultimately.
- President Donald Trump, 12/17/2017
So, you know, that didn’t happen.
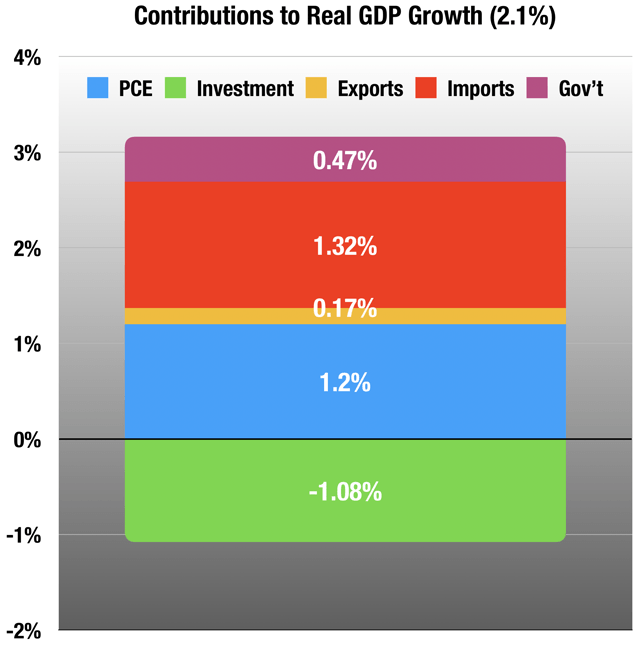
The bird’s-eye view shows us where the growth came from:

(Source: BEA)
Normally, PCE leads the way here, but this quarter, an astounding 63% of real GDP growth came from the collapse in imports (imports are subtracted from GDP), down -8.7% in the quarter. We see only a small corresponding bump from exports. I’ll have a lot more to say about this in my full report.
PCE makes up about 70% of real GDP, so this is the driver of growth - not just in the US, but globally. Real core PCE was up 2%, much lower than it needs to be for sustained 3% growth. Real PCE came in a little lower at 1.8% because of declining energy prices.
Real core PCE goods was only up 1.8% in the Christmas quarter (remember, these are seasonally adjusted), which tells me it was not a very merry Christmas for retail. This is a big letdown after two very strong quarters for PCE goods in a row.
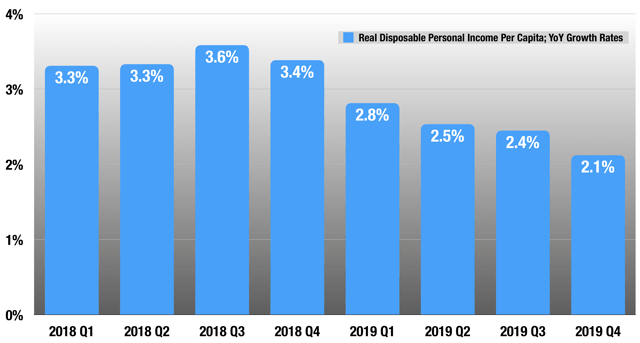
The reason is twofold. In the first place, income growth is beginning to taper. Real disposable income per capita, the bottom line of the income tables:

(Source: BEA)
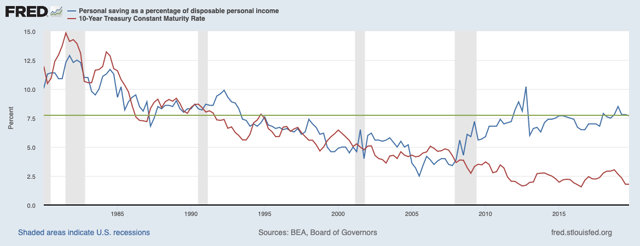
The second reason for weak PCE growth is the abnormally high personal savings rate, at 7.7% this quarter. Moreover, this has been happening this entire cycle:

As long-term interest rates declined from 1981 to 2007, the personal savings rate went right along with it, as expected. But since the financial crisis, we see a huge shift in savings preference. The last time the savings rate was this high, the 10-year Treasury paid over 7.5%. The average rate for the 10-year in Q4 was 1.8%. What is saved is not consumed, so PCE growth this cycle has been well below that in the previous 30 years.
But this has even larger implications: the phenomenon of “secular stagnation” - low growth, low rates, and low inflation, with central banks seemingly powerless to break out of it. The high savings rate is the main driver here.
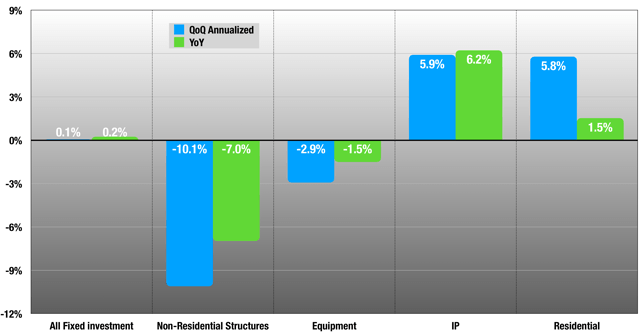
It not only puts a ceiling on consumption, but that has also caused fixed investment growth to be very poor this cycle, despite historically low cost of capital. This is accelerating right now.

(Source: BEA)
As you can see, every category is decelerating in the quarter except for residential investment, which had a nice turnaround quarter after 7 negative growth quarters in a row dating back to Q1 2018. IP investment continues to grow well, but is way off its peak rates of near 12% in 2018.
There was also some destocking in the quarter, which led to a -1.1% contribution to real GDP growth from investment
All of this keeps inflation below the Fed’s target, down to 1.6% in Q4 from 1.7% in Q3.
Finally, Federal government spending keeps growing rapidly, led by defense spending, Medicare, Social Security and Medicaid, in that order.
I’ll have a full report on Q4 GDP, including an update on all the Fed shenanigans, early next week.
Disclosure: I/we have no positions in any stocks mentioned, and no plans to initiate any positions within the next 72 hours. I wrote this article myself, and it expresses my own opinions. I am not receiving compensation for it (other than from Seeking Alpha). I have no business relationship with any company whose stock is mentioned in this article.