Bitcoin - Correction Soon To Be Over
by Florian GrummesSummary
- Bitcoin has been stuck in a bear market since December 17th, 2017.
- Its weekly chart is oversold and probably close to a trendchange.
- Professional money has not yet fully positioned for a new rally.
- There is sentiment signaling fear and anxiety.
- Bitcoin is a contrarian buying opportunity.
Bitcoin (BTC-USD) has been in a correction since late June. Prices below US$8,000 have been anticipated and are now reality. So far, the fourth quarter has not (yet) brought any larger recovery. Instead the downtrend is still intact. However, it seems that the correction is in its final stage and Bitcoin's remaining downside risk is rather small compared to the upside potential.
Review
In the big picture Bitcoin is still stuck in a bear market since December 17th, 2017. The strong rebound in spring topped out at US$13,887 on June 26th, 2019, and reached the 61.8% fibonacci retracement of the previous wave down from US$20,000 to US$3,200.
As expected, since this year's high point the prices for Bitcoin have dropped significantly over last five months. In the last four weeks, Bitcoin prices have not been able to break free from the downtrend channel, which has been intact since the end of June. Rather, prices plunged significantly lower into the early-mentioned buying zone between US$6,200 and US$8,200. With the new low at US$6,515, all low-points in recent months have been clearly undercut. Therefore, the medium-term downtrend is still intact.
Nevertheless, there has been a bounce in the last 12 days, which has led to a price increase of just around US$1,400 (up 21.5%) to US$7,865. So far however, the bulls have not been able to defend these price gains and Bitcoin is currently trading around the middle trend line within its downtrend channel around US$7,300 and US$7,400.
Technical Analysis For Bitcoin
Source: Tradingview
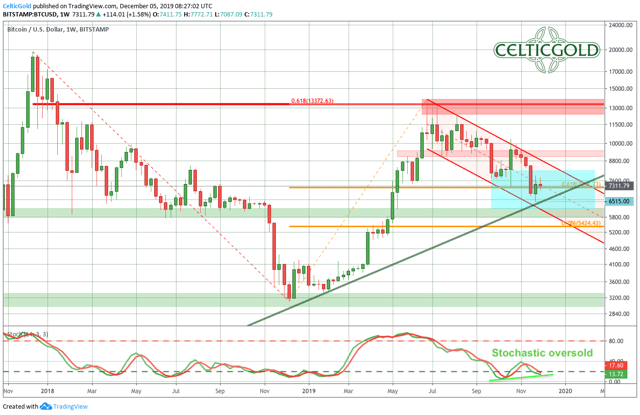
On the weekly chart, the current downtrend oha forced prices below the uptrend channel established since the beginning of February. At the same time, prices have been approaching the even more important uptrend line which had been established since autumn 2015. Basically, this trend line represents the quantum leap from three-digit to five-digit Bitcoin prices. Ideally, this trend line should hold!
However, the move below the 61.8% Fibonacci retracements at US$7,231 has already activated the next lower 78.6% retracement at US$5,424. Also below the four-year uptrend line sits the next support zone between US$5,700 and US$6,200.
On the other hand, the stochastic oscillator is oversold and has not confirmed the recent lower low which indicates a first sign of positive divergence and a potential trend-change.
Overall, the correction on the weekly chart already seems to be well advanced. The bears are face a very strong cluster of supports. The turnaround is therefore within reach, but could be delayed one more time with a final price slide below the psychological number of US$6,000. In any case, prices below US$7,500 offer a good medium and long term opportunity as the risk/reward ratio becomes more and more favorable. Contrarian investors are therefore in accumulation mode, because Bitcoin has reached a promising buying zone.
Source: Tradingview
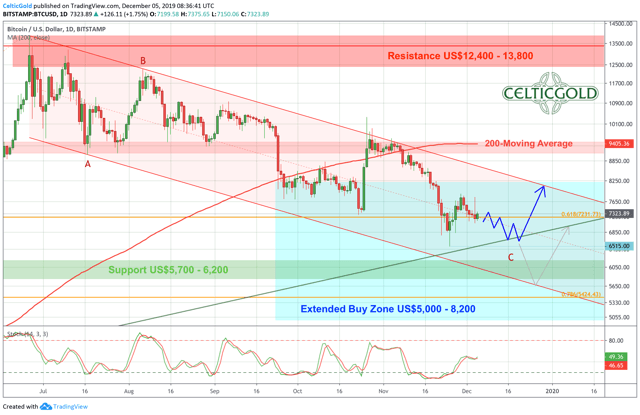
On the daily chart, Bitcoin currently trades around the middle trend line of the larger downtrend channel which is in place since the end of June. Despite the rapid recovery in the last week of November, a turnaround can not be confirmed yet. The long wick of the daily candle on November 25th however looks potentially like a trend reversal!
Another test of the important 4-year uptrendline as well as those recent lows in the range of US$6,500 to US$6,800 US dollars would be conceivable within the next few weeks. Should the uptrendline hold there (ideally with a slightly higher low than in November), a very important piece of the puzzle would be in place. Alternatively, there will be a final sell-off that might take advantage of the full downtrend channel and could push prices below US$6,000.
In summary, the daily chart is neutral. The chance for a successful double low in the range of US$6,500- US$6,800 is undeniable but not yet confirmed. On the other hand, if the four-year uptrend line does not hold, Bitcoin should at least test the support zone between US$5,700 and US$6,200.
Commitments of Traders Report For Bitcoin
Source: Barchart
The Bitcoin Future started trading on December 17th, 2017. Back then, it was already clear that this introduction of Bitcoin Futures would pierce the Bitcoin bubble (the first bubble after the financial crisis of 2008). Now, Christopher Giancarlo, former chairman of the US Commodity Futures Trading Commission (CFTC), has confirmed this in an interview.
Nevertheless, the CoT report published on Friday evenings provides a good overview of the positioning and is always helpful in analyzing the Bitcoin market. This time around, the CoT report was released in the current week due to the Thanksgiving holiday.
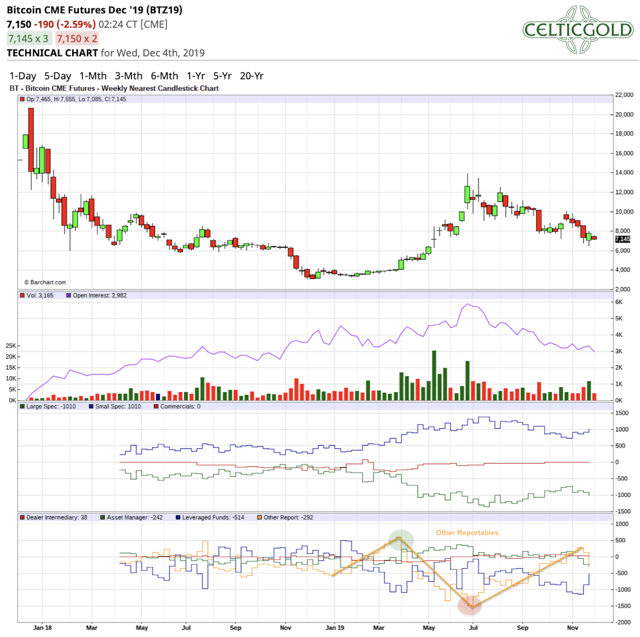
All in all, over the course of the last five-month the correction led to significant shifts in the derivatives market. Above all, however, the open interest has fallen significantly, indicating overall falling activity. Interestingly, however, is the behavior of the so-called "Other Reportables", which were able to successfully play the movements in Bitcoin with a contrarian approach. The group "Other Reportables" is not listed individually in the normal cot report and represents all reportable traders who can not be assigned to one of the three groups of producers, swap dealers or money managers.
The "Other Reportables" have reversed their short position from 1,500 to almost 250 long contracts in the last five months. Obviously, the low point at US$6,515 was not yet low enough for them to ramp up their long position to similar levels like in end of march (back around 500 contracts). From this we could concluded that Bitcoin still further need for correction and that the support zone around US$ 6,000 US dollar might have to fall too. In that case however, the weak hands would finally throw in the towel, while at the same time the group of "Other Reportables" could then expand their long position easily to over 500 contracts.
Overall, the analysis of the current CoT report provides a rather neutral signal. Although the setup has improved significantly in the last two months, the successful players have not yet moved sustainably to the long side.
Sentiment Bitcoin
Bitcoin Optix as of December 5th, 2019. Source: Sentimentrader
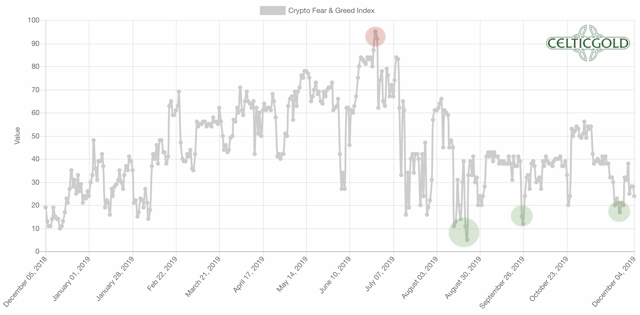
Crypto Fear & Greed Index as of December 5th, 2019. Source: Crypto Fear & Greed Index
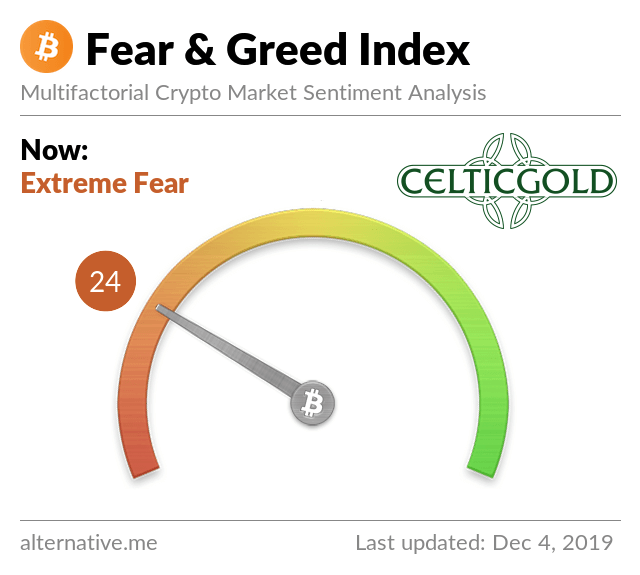
Crypto Fear & Greed Index as of December 5th, 2019. Source: Crypto Fear & Greed Index
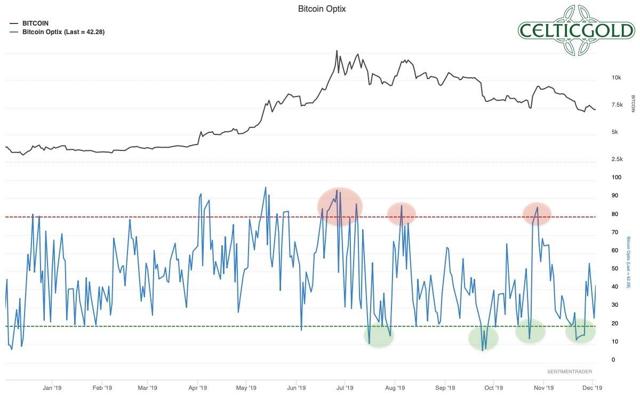
Parallel to the falling Bitcoin prices, the mood among crypto investors has also slipped further and further into the basement. While Sentimentrader's Bitcoin Optix currently only identifies a slightly exaggerated pessimism, the much more substantiated "Fear & Greed Index" has recently reached level of deep panic and fear. The all-time low for this indicator was seen in August and almost exactly a year ago at slightly below 10. The capitulation phase in the cryptosector could therefore still become a bit more painful.
In summary, there is already a high level of anxiety. From a contrarian point of view, this is a buy signal. Once the "Fear & Greed Index" falls to values between 8 and 15, the bottom and thus the turnaround is likely to be reached.
Seasonality Bitcoin
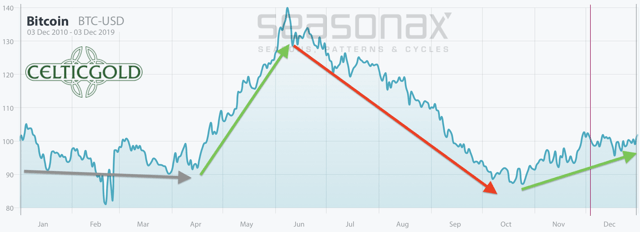
Source: Seasonax
Based on the evaluation of the last nine years, Bitcoin has developed a fairly clear seasonal pattern. Statistically, the 4th quarter is generally slightly positive. However in this year Bitcoin has not shown any strength in the 4th quarter so far as BTC-USD is trading around US$500 lower than in early/mid-October. Nevertheless, the seasonal component is slightly bullish until early January.
Bitcoin against gold
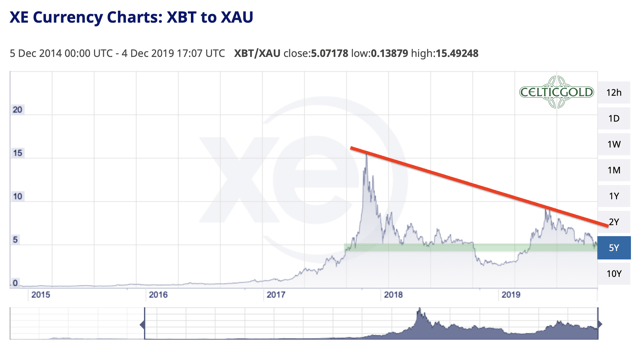
Source: XE
Currently, one Bitcoin costs 5.07 ounces of gold. In other words, you have to pay 0,2 Bitcoin for an ounce of gold! Overall, gold has appreciated almost 39% against Bitcoin over the past four months! In the big picture, Bitcoin has been in a downtrend against gold since December 2017. If the Bitcoin/Gold-ratio also falls below the support of 5 ounces per Bitcoin, the lows from about one year ago should likely be targeted, meaning 3 to 3.5 ounces per Bitcoin.
Generally, one should be invested in both asset classes. The recommended allocation in precious metals (primarily physical) should be at least 10% and a maximum of 25% of one’s total assets. In cryptos and especially in Bitcoin investors should hold at least 1% and a maximum of 5%. If you are very familiar with crypto currencies and Bitcoin, you can individually allocate higher percentages in Bitcoin. For the normal investor, who of course is invested mainly in equities and real estate, holding 5% in the highly speculative and highly volatile Bitcoin is already quite a lot!
Conclusion and recommendation
Bitcoin´s correction has been going on since the end of June and still does not seem to be over. Both, the futures market as well as sentiment indicate that it will take another low near or even below US$6,500.
At the same time, however, in the larger picture the opportunities clearly outweigh any concern. Bitcoin has retreated textbook like into our defined buy zone and now provides a contrarian buying opportunity. Anyone who has been patiently waiting for these low prices with staggered buy orders should now be invested at least 50%. Ideally, you still keep some powder dry in case Bitcoin overdoes it on the downside and temporarily undercuts all support. The probability for this is at maximum just 25%. Logically, a second leg in the range around US$6,500 to US$6,800 and then the turnaround is more likely. In any case significantly higher prices until early summer 2020 are to be expected.
Overall, Bitcoin has a remaining risk on the downside to US$5,000, while on the upside, the resistance zone between US$12,500 and US$13,800 is the measure of all things. If Bitcoin can sustainably move above this resistance zone next year, new all-time highs are only a matter of time. Prices below US$5,000 on the other hand, give rise to legitimate doubts as to whether Bitcoin will prevail at all.
Disclosure: I am/we are long BTC-USD. I wrote this article myself, and it expresses my own opinions. I am not receiving compensation for it. I have no business relationship with any company whose stock is mentioned in this article.