USD/CAD price analysis: Greenback trades sideways against Canadian dollar, near 1.3250 level
by Flavio Tosti- USD/CAD is correcting last week upmove in quiet Monday’s trading.
- The level to beat for buyers is the 1.3282 resistance.
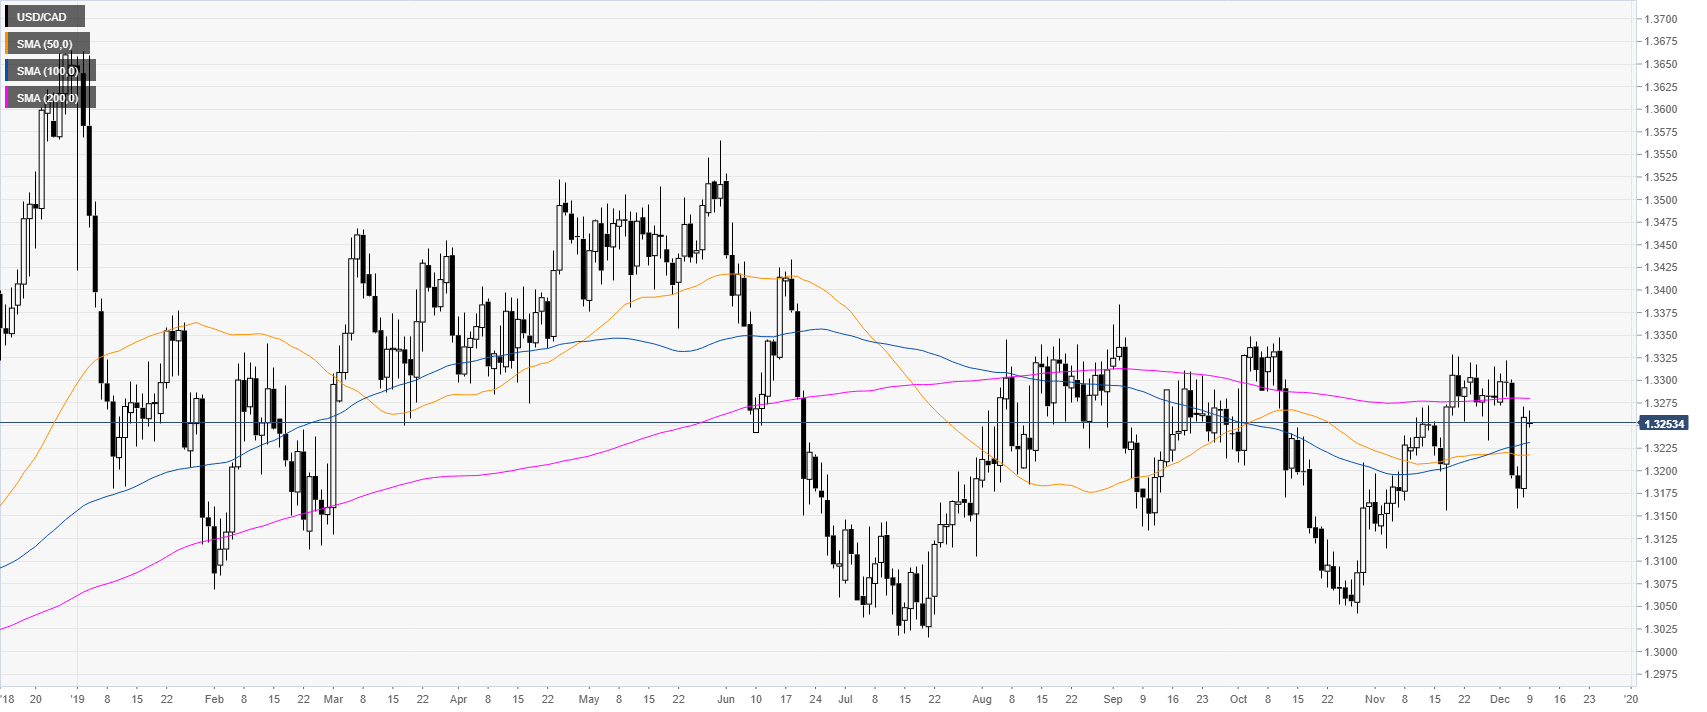
USD/CAD daily chart
The loonie on the daily chart is consolidating last Friday’s surge. This Monday, the spot is trading quietly between the 100 and 200-day simple moving averages (DMAs).

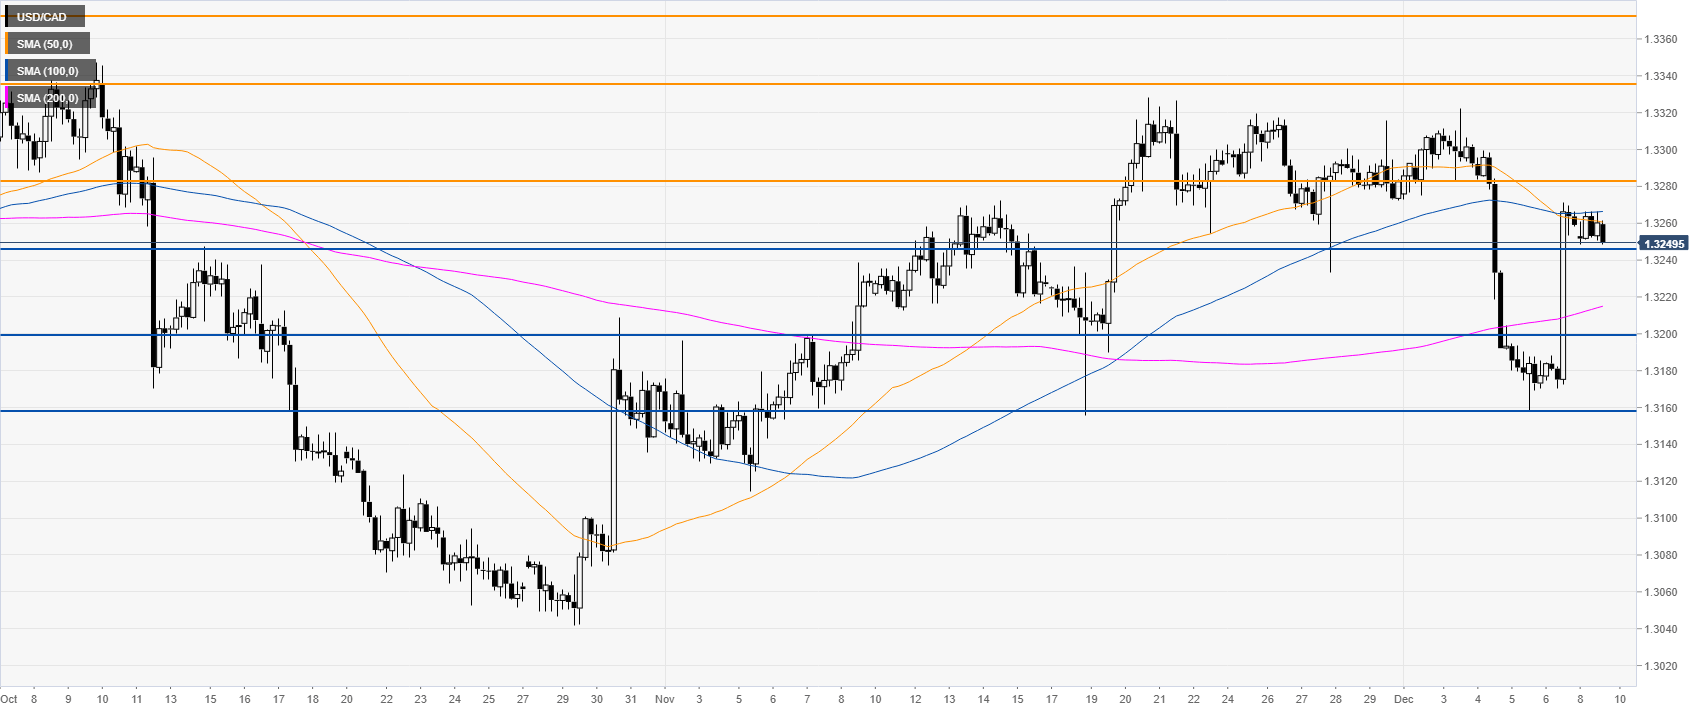
USD/CAD four-hour chart
USD/CAD got a substantial boost at the end of last week and the market is currently correcting that move. Buyers want to capitalize on the momentum and break the 1.3282 resistance to drive prices towards the 1.3337 level. Further up lies the 1.3371 resistance, according to the Technical Confluences Indicator.

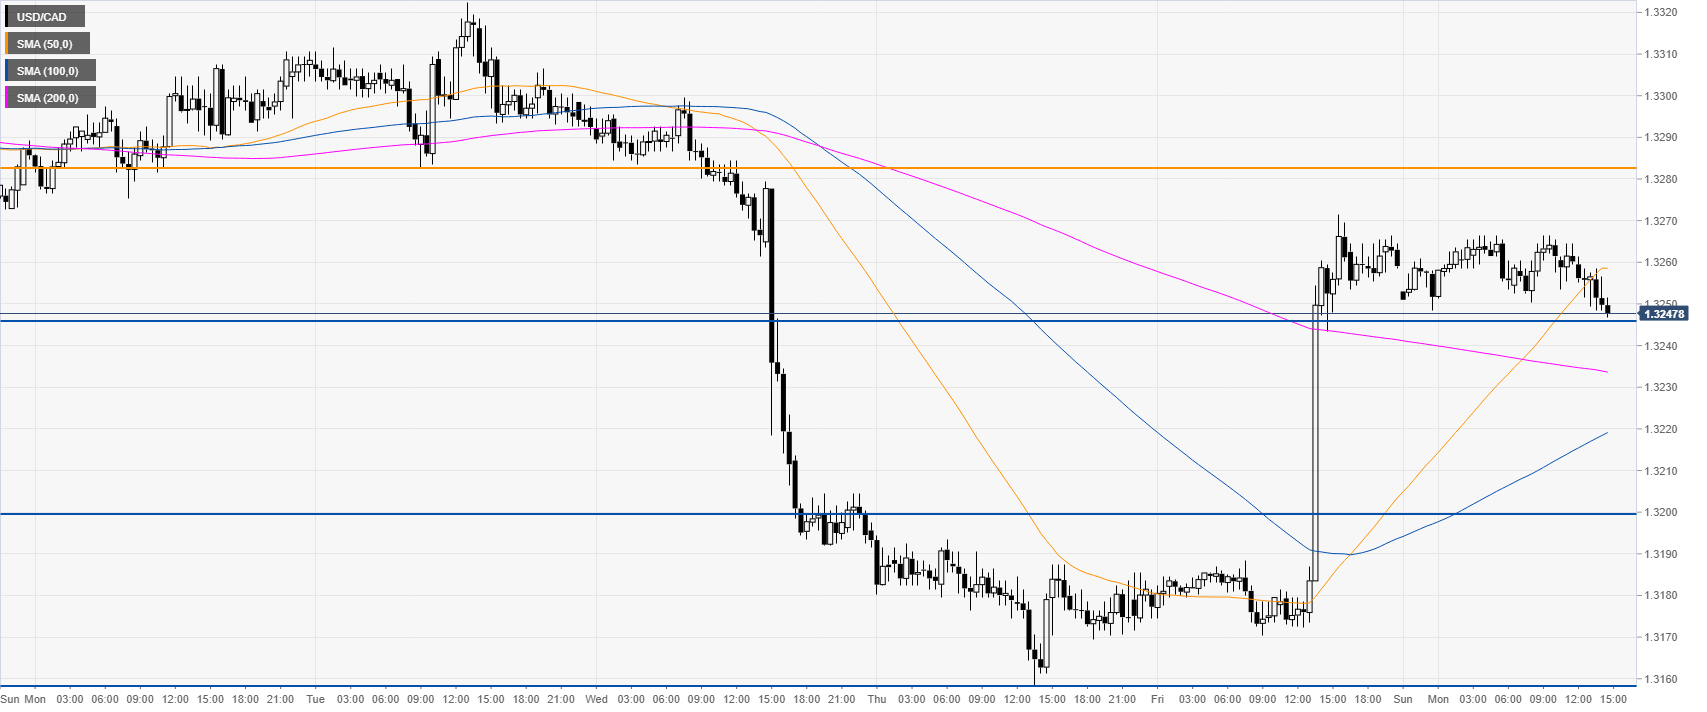
USD/CAD 30-minute chart
USD/CAD is having a sideways consolidation above the 100 and 200 SMAs. Bulls will try to defend the 1.3247 support. However, failure to do so can see the 1.3200 handle back into play for bears. Further down lies the 1.3158 support level.

Additional key levels
USD/CAD
| Overview | |
|---|---|
| Today last price | 1.325 |
| Today Daily Change | -0.0009 |
| Today Daily Change % | -0.07 |
| Today daily open | 1.3259 |
| Trends | |
|---|---|
| Daily SMA20 | 1.326 |
| Daily SMA50 | 1.3217 |
| Daily SMA100 | 1.323 |
| Daily SMA200 | 1.328 |
| Levels | |
|---|---|
| Previous Daily High | 1.3272 |
| Previous Daily Low | 1.317 |
| Previous Weekly High | 1.3322 |
| Previous Weekly Low | 1.3158 |
| Previous Monthly High | 1.3328 |
| Previous Monthly Low | 1.3114 |
| Daily Fibonacci 38.2% | 1.3233 |
| Daily Fibonacci 61.8% | 1.3209 |
| Daily Pivot Point S1 | 1.3196 |
| Daily Pivot Point S2 | 1.3133 |
| Daily Pivot Point S3 | 1.3095 |
| Daily Pivot Point R1 | 1.3297 |
| Daily Pivot Point R2 | 1.3335 |
| Daily Pivot Point R3 | 1.3398 |