The Phantom Metric: What Really Drives U.S. Equity Valuations?
by AllianceBernstein (AB)Summary
- Investors continue to question whether US equity valuations are too high, particularly for growth companies and versus other global markets.
- The risk premium is a good gauge of market sentiment.
- Valuation questions can be a red herring for investors.
By Frank Caruso and Vincent Dupont
Investors continue to question whether US equity valuations are too high, particularly for growth companies and versus other global markets. But standard valuation metrics don't tell the whole story. Understanding the cost of capital can provide essential insight on valuing stocks.
US stocks have surged this year. The S&P 500 Index advanced by 28% through November 30 and is trading at a price/forward earnings ratio of nearly 18×, about 24% higher than its 15-year average. Yet standard P/E metrics are narrow indicators that don't capture the macroeconomic or market context of valuation. To do that, investors need to go back to basics and look at what really drives the value of securities.
Expected Return: The Ultimate Measure of Value
What is the expected return of an investment? This is perhaps the most important question that investors ask when buying any security. By assuming the risk of an investment, we want to know what we're likely to get back. A security's expected return is a function of its price movements, which adjust constantly until buyers and sellers are in balance.
For some investments, the expected return is easy to observe. For example, if you lend $100 to your friend for an agreed 6% interest rate, you'll be getting a return of $6. With corporate and government bonds, the electronically quoted yield is what you can expect to earn by holding the bond to maturity.
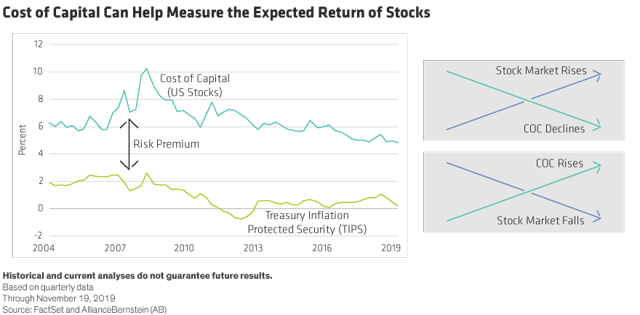
Stocks provide no such clarity. That's because there's no direct way to observe a stock's expected return. But the "Cost of Capital" (COC) can help. It measures the rate of return that a company must earn on its investments to be profitable. As such, the COC is a good measure for the expected return of each stock - and the market.
The Risk-Free Rate
To interpret the COC, start with the so-called risk-free rate (RFR). The RFR is the near certain reward - or cost, if rates are negative - that you can expect from holding onto your cash instead of bearing the risks of investment. By buying a stock or bond, an investor decides to forgo the RFR. What determines the RFR is a hotly debated subject among economists. However, a good proxy for the RFR is the yield on the 10-year Treasury Inflation Protected Security (TIPS), a bond issued by the Federal Government that guarantees an after-inflation return. That yield is just above zero today.
Since stocks are riskier than the TIPS, the COC should always exceed the RFR. This spread between them is the so-called risk premium (Display). So, if the COC is 7% and the RFR 2%, then the risk premium is 5 percentage points.

What does this spread have to do with valuations? As the stock market rises while expectations about future earnings remain unchanged, it becomes more expensive. Since investors will get less return for every dollar put into the market, the market's expected return - the COC - has declined.
On the other hand, if the RFR and the COC fall by exactly the same amount, the risk premium remains unchanged. This means that the stock market's valuation relative to other financial assets hasn't really changed.
What Does the Risk Premium Signal?
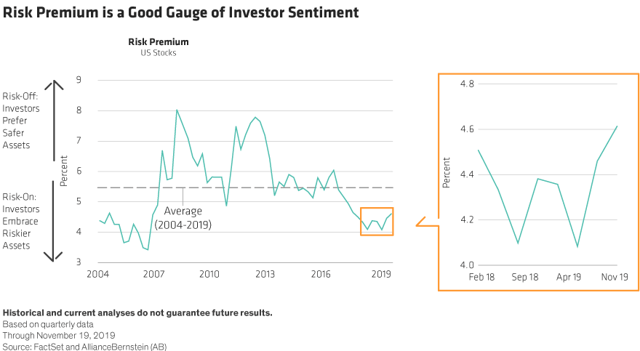
The risk premium is a good gauge of market sentiment. In times of fear, the risk premium widens as investors shun risky corporate income in favor of safe government bonds, pushing down yields. That said, the COC and the TIPS yield typically move together, meaning the risk premium tends to fluctuate at around a constant value of about 5.5%, according to our estimates (Display).

By mid-2018, the risk premium became unusually low. It expanded again as the stock market fell later that year. From early 2019 until recently, the risk premium remained fairly constant, even though the stock market rose sharply. That means the market became more expensive in absolute terms, but not in relative terms, for most of this year.
Expensive? Yes and No
Valuation questions can be a red herring for investors. In our view, even if the market is expensive on traditional metrics, as it is today, the real question is whether the risk premium is unusually high or low. In other words, are risk appetites so extreme that we can expect them to revert to a more normal level?
We don't think so for now. The risk premium is currently at about 4.6%, slightly lower than its 15-year average. However, if the stock market keeps rising, driving the COC lower, and the TIPs yield stays constant or even rises, then the risk premium will shrink. And it could fall to an extremely low level before long.
So, is the US stock market expensive? Our answer: yes, in absolute terms (based on both the absolute value of the COC and common metrics such as P/E), but only somewhat in relative terms. However, since the risk premium isn't extremely high or extremely low, we don't think it is signaling a sharp potential reversal or downturn.
Timing market inflection points is almost never a good idea, in our view. Instead, we think it's more useful to take the current estimated COC of 5.5% as a rough guide to what you can expect from investing in the market in current conditions. Yet even in a world of relatively modest returns, investors who focus on companies with sturdy business models, healthy balance sheets and the ability to earn economic returns in excess of their COC should be able to generate stronger equity return potential than the market over time.
The views expressed herein do not constitute research, investment advice or trade recommendations and do not necessarily represent the views of all AB portfolio-management teams and are subject to revision over time.
Editor's Note: The summary bullets for this article were chosen by Seeking Alpha editors.