'Bull Markets Often End With A Euphoric Rally Called A 'blow-Off Top.' We May Have Just Had One'
by Bill KortSummary
- The current flatfish top has zero resemblance to the 2000 market top.
- I think this secular bull market has further to run and will end on a note more similar to that of 2000.
- One thing I'm pretty sure of is that our current market high no more resembles a euphoric rally/"blow-off top" than your's truly resembles or ever resembled Adonis.
Another 'OMG' moment from the financial media
They must be doing this on purpose (click bait) because no serious observer of the markets could even come close to calling the market's action over the past few weeks a blow-off top. However, CNBC found themselves an analyst (a serious observer) who would make that assertion, Ned Davis, founder of Ned Davis Research.
According to Ned Davis Research, the Dow has posted a median gain of 13.4% during blow-off tops dating to 1901. The median rally length was 61 days."
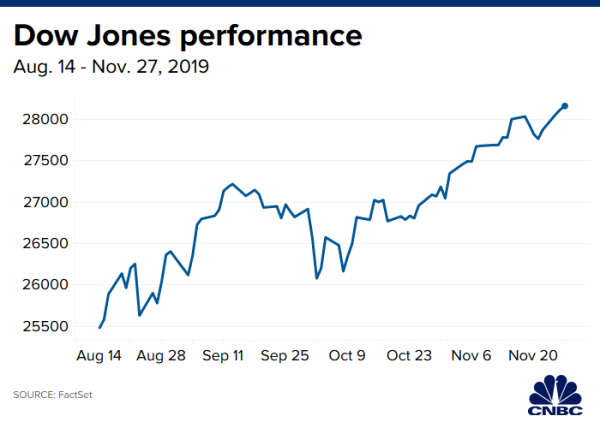
This is very worrisome to Mr. Davis because in the period mid-August to late November we've seen the Dow up 10.5% in 74 days. In the CNBC article he is quoted, "Given the high valuations I see, plus these divergences between many different indices, I am aware that many bull markets have ended with a rally similar to what we have seen since August, … "
According to the article …"One rally similar to this one happened between Oct. 15, 1999, and Jan. 14, 2000, just before the dot-com bubble burst. The Dow rallied 17% over 64 trading days back then. Another one took place from Aug. 16, 2007, to Oct. 9, 2007, preceding the financial crisis. In that time, the Dow jumped 10.3% in just 38 trading days." Thus, the author, Fred Imbert, stirs in more fear and trepidation with a glance back at the thing investors fear most in the rear-view mirror.
What does a blow-off top look like?
I think a better definition comes to us from Investopedia:
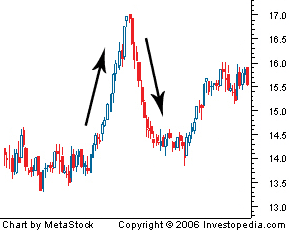
A blow-off top is a chart pattern that shows a steep and rapid increase in a security's price and trading volume followed by a steep and rapid drop in price usually on significant or high volume as well. The rapid changes indicated by a blow-off top, also called a blow-off move or exhaustion move, can be the result of actual news or pure speculation."
They look like the chart below:

The best example of a real blow-off top listed in the CNBC post was the period between October 15, 1999, and January 14, 2000. This was the blow-off that ended the secular bull market that began in 1982 at 1,050 on the Dow and ended in March of 2000 with the Dow at 11,497.
This is what the current, so-called, blow-off top looks like:

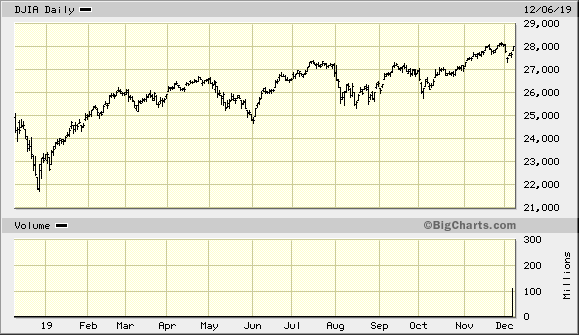
This especially in the context of the one-year chart below bears little resemblance to a blow-off top.

"Big Charts" courtesy of MarketWatch
A little more perspective, please
Okay. The Dow Jones Industrial average began 1995 at 3,834. It closed 1999 at 11,497, up 200% in 5 years. It continued to make new highs in 2000, this on the heels of a 25% up move in 1999. That, my friends, is what a blow-off top in a secular bull market looks like. The current flatfish top has zero resemblance to the 2000 market top.
Sure, we could be on the verge of a serious correction or even a cyclical bear market (as defined a 20% or more correction in the index). I don't know. I do know the prediction business is tough. So is trading. I also know that Ned Davis is not a perfect predictor. This causes me to ask why anyone would consider this article useful information? My answer is that it is useless and it only sees the light of day as 'click bait' … something to ensnare you. Please do not bite. I think this secular bull market has further to run and will end on a note more similar to that of 2000.
One thing I'm pretty sure of is that our current market high no more resembles a euphoric rally/"blow-off top" than your's truly resembles or ever resembled Adonis.
Editor's Note: The summary bullets for this article were chosen by Seeking Alpha editors.