Natural Gas - Something Needs To Happen Soon
by Andrew HechtSummary
- The January contract displays an oversold condition.
- Stocks are slowly dropping.
- It is too early for carnage on the downside, but time is running out.
- The spring of 2020 could be ugly - an opportunity.
- U.S. energy policy could change after the election - for now, a trading paradise.
Thanksgiving has passed, and the Christmas and New Year's holidays are only weeks away. The official start of the winter season is on December 21, a day that the sun in my home city of Las Vegas sets at 4:30 PM. Since I live in the most eastern part of the pacific time zone, the shortest day of the year is indeed brief. Las Vegas is the nightlife capital of the US and perhaps the world. An early sunset is not such a big deal when it comes to sin city.
It is hard to believe that the coldest months of winter are still ahead based on the price action in the natural gas futures market. On the final trading day of November, the peak season January futures contract dropped to a low at $2.27 per MMBtu. Considering that January futures declined to $2.475 in early August when the nearby futures contract traded to its lowest price since 2016 at $2.029, the energy commodity has been trading more like spring is right around the corner.
Natural gas is one of the most volatile futures markets, and it is always full of surprises. The recent bearish price action gave way to a recovery last week that lifted the price to the $2.40 per MMBtu level on Friday, December 6. The price was still below the August low when it comes to the January contract.
It is still very early in the winter season for the price of natural gas to fall apart. We could see lots of price volatility over the coming days and weeks, which creates trading opportunities for nimble traders with their fingers on the pulse of the energy commodity. The most direct route for a risk position in natural gas is via the futures and futures options that trade on the NYMEX division of the CME. For those who do not venture into the futures arena, the Velocity Shares 3X Long Natural Gas ETN product (UGAZ) and its bearish counterpart (DGAZ) provide an alternative that magnifies the price action in the natural gas market on a short-term basis.
The January contract displays an oversold condition
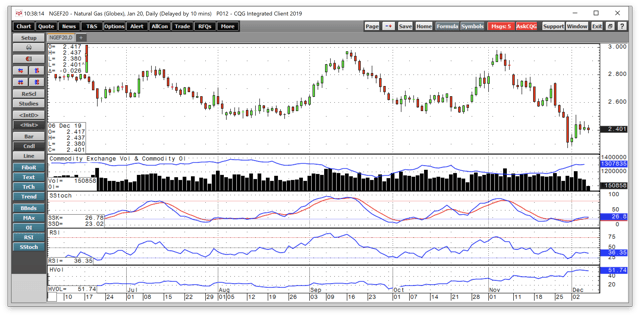
The move to $2.27 per MMBtu on the nearby January natural gas futures contract on November 29 was a bit too much too soon considering the time of the year.
Source: CQG
As the daily chart highlights, the move to the downside sent price momentum and relative strength indicators into oversold territory. Meanwhile, in what had been a bearish sign for the natural gas futures market, the open interest metric rose from 1.176 million contracts on November 21 when the price was around $2.60 per MMBtu to 1.308 million contracts on December 5 with the price over 20 cents lower. When the number of open long and short positions in a futures market increases as the price declines, it tends to be a technical validation of a bearish price trend. Meanwhile, the push to the lows sent daily historical volatility to over 50%. Natural gas ran out of selling at the end of November. Last week, the price recovered and reached a high of $2.51 on December 3. Natural gas was trading at just over $2.40 per MMBtu on Friday, December 6, as the price rejected the low for now.
Stocks are slowly dropping
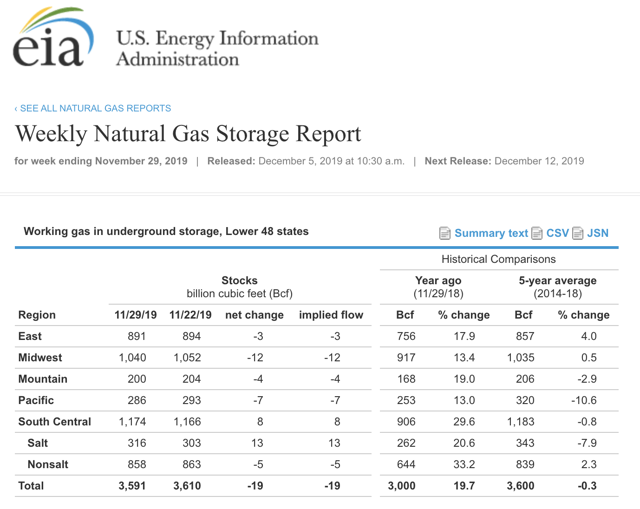
In what could be a bullish sign for the natural gas futures market, the price moved higher after the EIA delivered a bearish inventory report on December 5. The market had expected stocks of the energy commodity to decline by 41 billion cubic feet for the week ending on November 29.
Source: EIA
The chart shows that the EIA reported a decline of only 19 billion cubic feet for the final week of November. Inventories in storage around the US was 19.7% above last year's level, but still 0.3% below the five-year average for this time of the year.
The inventory report was bearish, but the price action was not.
Source: CQG
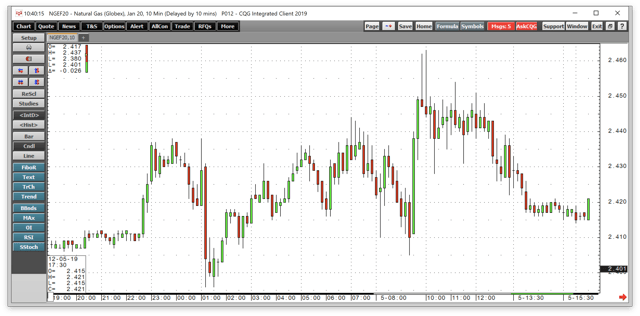
The ten-minute chart illustrates that the price was trading at as low as $2.405 before the inventory report and bounced to a high of $2.463 per MMBtu after the release. While the price action on the upside was far from exciting, it was a sign that the market ran out of selling. Natural gas drifted back to the $2.40 level at the end of last week.
It is too early for carnage on the downside, but time is running out
There is still a lot of winter weeks ahead, which means plenty of snow will fall across the US over the coming months. We are at the very beginning of the heating season. Still, inventories at almost 3.6 trillion cubic feet at the end of November means that the natural gas market will need to see stocks drop dramatically over the coming weeks to support any significant rally.
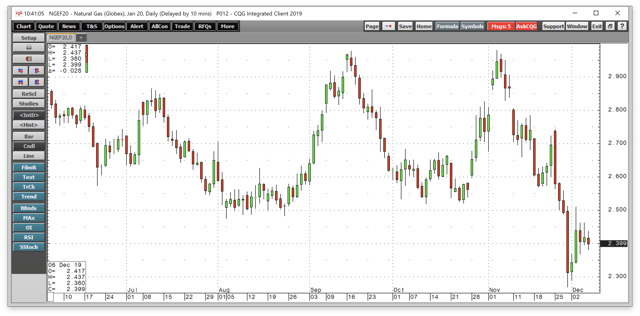
While I expect the price to hold the recent low at $2.27 per MMBtu on the downside, it is not likely to run away on the upside. Perhaps the most bullish factor facing the futures market is the island reversal pattern on the daily and weekly charts that continues to stick out like a sore thumb.
Source: CQG
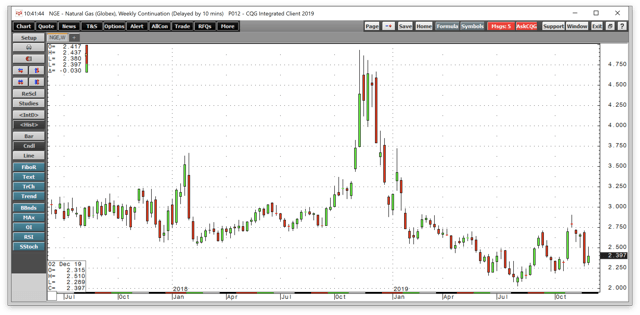
On the daily chart of January futures, the narrow gap is from $2.826 to $2.829.
Source: CQG
On the weekly chart, it stands at $2.738 to $2.753 per MMBtu. Gaps on charts often act as magnets for prices. At the $2.40 level, a move to fill the voids would offer a double-digit percentage gain for those holding long positions at the Friday, December 6 closing level.
The spring of 2020 could be ugly - an opportunity
The last time that natural gas futures fell below $2.27 during the final two months of the year was in November and December 2015. In November 2015, natural gas reached $2.051, and the following month, the price fell to a low at $1.684 per MMBtu. After a recovery that took the price to a high at $2.495 in January 2016, the price melted to its lowest level since the late 1990s at $1.661 in March at the start of the injection season.
A repeat performance in 2020 could mean that prices will probe below the $2 level and could challenge the 2016 low when this winter season ends. The price action has been bearish at the time of the year when it should be the most bullish. Therefore, we could see lots of selling, particularly if Mother Nature does not deliver colder than average temperatures over the rest of December and through January and February and into March.
A significant downdraft in the natural gas futures market could set the stage for wild volatility next year at this time. The chances for increased price variance next year may not come from Mother Nature, but the 2020 US election.
U.S. energy policy could change after the election - for now, a trading paradise
President Trump's regulatory reforms encouraged oil and gas production. Along with technological advances in fracking and massive discoveries of reserves, the US is now the world's leading oil and gas producing nation.
The President will likely limp into the 2020 election with the tarnish of impeachment, even though the Senate is not likely to convict and remove him from office. At the same time, the Democrats have embraced the "Green New Deal" that could dramatically change US energy policy starting in January 2021.
Senator Elizabeth Warren pledged that she would ban fracking on day one of her administration. Other Democrats have pledged to shift US energy policy. A victory by the opposition party would likely cause a significant decline in oil and gas output in the US. We could see the natural gas market react to the potential for a change next year at this time.
Meanwhile, the volatile natural gas market could see an increase in price variance over the coming weeks. While the price will move higher and lower with the weather than inventory reports, the gaps created by the island reversal pattern could still support a recovery that would yield an attractive return for the longs.
The most direct route for a risk position in the natural gas market is via the futures and futures options that trade on the NYMEX division of the CME. For those looking to participate in the volatile energy commodity and magnify price action, the Velocity Shares 3X Long Natural Gas ETN product and its bearish counterpart DGAZ are useful and highly liquid short-term tools.
The fund summary for UGAZ states:
The investment seeks to replicate, net of expenses, three times the performance of the S&P GSCI Natural Gas Index ER. The index comprises futures contracts on a single commodity and is calculated according to the methodology of the S&P GSCI Index. Source: Yahoo Finance
UGAZ has net assets of $863.77 million, trades an average of over 22.9 million shares each day, and charges an expense ratio of 1.65%. The bearish DGAZ product operates inversely. DGAZ has net assets of $224.93 million, with over 1.275 million shares changing hands on an average session. DGAZ charges the same 1.65% expense ratio as UGAZ.
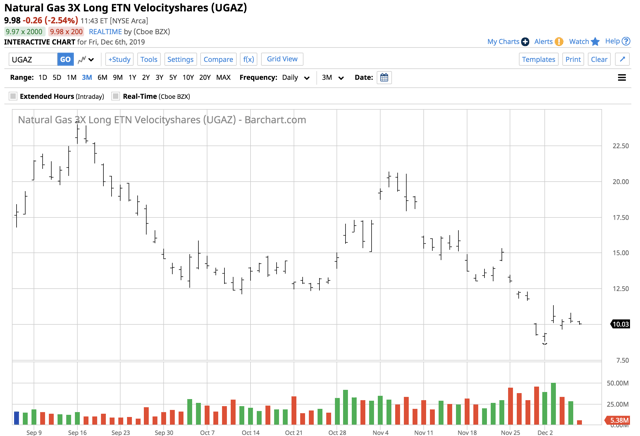
The price of January futures rose from $2.27 on November 29 to a high at $2.51 on December 3 or 10.57%.
Source: Yahoo Finance
As the chart highlights, UGAZ moved from $8.80 to $11.34 per share or 28.86%, over the same period. UGAZ delivered just under a triple percentage return for those who bought the low and sold the high in the product compared to the futures market.
UGAZ and DGAZ are not appropriate for medium or long-term risk positions in the natural gas market. Both products undergo period reverse splits as their leverage comes at a price, which is time decay.
The odds favor a move to fill the gaps on the daily and weekly charts in the natural gas futures market. However, when it comes to the price path of the energy commodity over the coming weeks and months, the prospects remain bearish. A move that fills the voids will likely attract lots of selling that could make the coming weeks a hectic time in one of the world's most volatile commodities.
The Hecht Commodity Report is one of the most comprehensive commodities reports available today from the #2 ranked author in both commodities and precious metals. My weekly report covers the market movements of 20 different commodities and provides bullish, bearish and neutral calls; directional trading recommendations, and actionable ideas for traders. I just reworked the report to make it very actionable!
I am offering a 20% discount for an annual subscription to my service, The Hecht Commodity Report, through December 2019. With the holiday spirit in mind, I am offering a free trial to the service. You can sign up via this link.
Disclosure: I/we have no positions in any stocks mentioned, and no plans to initiate any positions within the next 72 hours. I wrote this article myself, and it expresses my own opinions. I am not receiving compensation for it (other than from Seeking Alpha). I have no business relationship with any company whose stock is mentioned in this article.
Additional disclosure: The author always has positions in commodities markets in futures, options, ETF/ETN products, and commodity equities. These long and short positions tend to change on an intraday basis.