Here’s How the US-China Trade War is Helping JD.com Stock Bulls, Bears
Now more than ever investors need to watch JD stock chart rather than relying on headlines
The specter of trade war uncertainty reared its head on Wall Street yet again last week. But when it comes to investing in JD.com (NASDAQ:JD), the only trade war to be concerned with is the one on the JD stock price chart. Let me explain.

JD.com has been likened to China’s Amazon (NASDAQ:AMZN). Not that JD is alone in that regard. Alibaba Group (NYSE:BABA) has earned similar comparisons. Still, given JD’s large online retail presence overseas, as well as its growing logistics and services businesses it would be hard not to make the association. And with that territory, much like AMZN stock has been over the years, JD.com is a battleground stock.
As for the trade war found on JD.com stock’s price chart, currently many bulls and bears are waiting on the next move in the game of political chess being waged by the U.S. and China. Those investors may also have to wait a bit longer before taking a position in JD stock.
Following last week’s NATO summit and a blitz of switch-hitting comments by POTUS, Dec. 15 has become a very important date for many investors. That’s when the U.S. is set to implement a new round of tariffs on China totaling roughly $156 billion. But will it?
Tethered to that uncertainty or wild card, the market is expected to “toggle up and down” until then, according to wealth manager Matthew Keator. It’s a view shared by many on Wall Street. But will it play out like that? What happens once new information hits the market? And what will happen to JD.com?
The fact is new or dormant market risks are always right around the corner. They’re inevitable. That being said, a very interesting pattern on JD stock’s price chart with large implications for bulls and bears looks worthy of putting on the radar.
JD Stock Price Monthly Chart

Source: Charts by TradingView
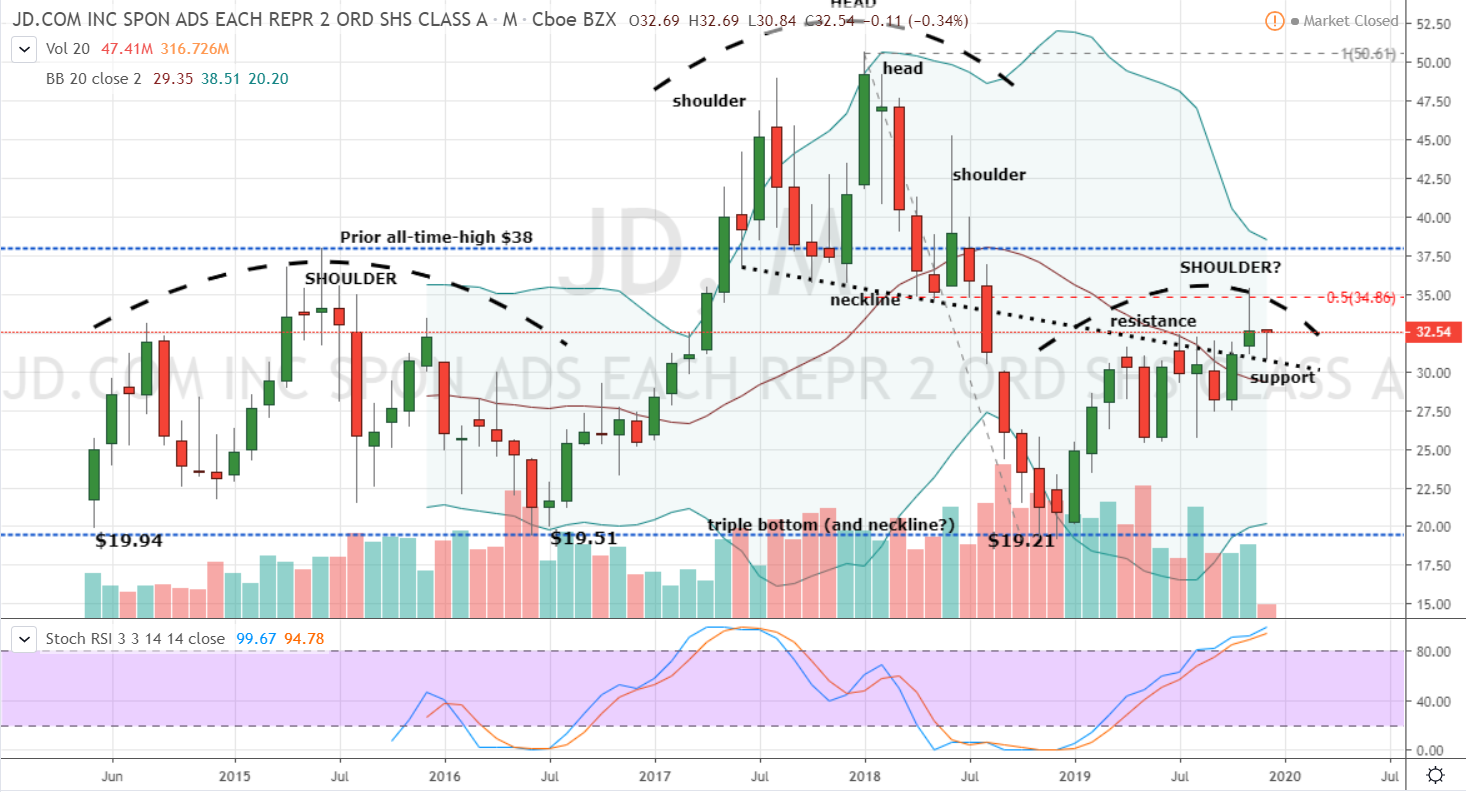
The monthly chart of JD.com shows two head-and-shoulder patterns. The smaller formation which developed from mid-2017 to mid-2018 played out well for bears. Shares broke neckline support near $34 and never looked back until bottoming in a triple bottom pattern just below $20 last December.
A rally off the low in 2019 has put JD stock bulls against similar, but possibly much larger challenges. Shares were stymied last month by the 50% retracement level while forming a bearish topping candle. This has established the right shoulder of a second and much larger head and shoulders pattern.
Coupled with an overbought stochastics, bears have some obvious technical ammo. To that end a ‘second attempt’ short of JD.com beneath the November candle’s low offers modest risk with potentially much larger payoff.
Don’t Write Off JD Stock Bulls
Still, don’t write JD stock bulls off just yet. That could be a very costly mistake.
The fact is JD stock is much closer to the shoulder’s pattern high. Also, JD.com stock recently found technical support from a successful challenge of the smaller neckline. The combination hints at a potential pattern failure. Moreover, with the shoulder’s high aligned at the 50% retracement level, a breakout above this key chart resistance should be a huge buy signal for JD bulls.
In conclusion JD.com’s trade war playing out on the price chart looks very promising for bears and bulls. But regardless of which group wins this battle, respecting those same lines in the sand to ensure a more ironclad, risk-adjusted proposition is advised.
Disclosure: Investment accounts under Christopher Tyler’s management do not currently own positions in securities mentioned in this article. The information offered is based upon Christopher Tyler’s observations and strictly intended for educational purposes only; the use of which is the responsibility of the individual. For additional market insights and related musings, follow Chris on Twitter @Options_CAT and StockTwits.