The Yen Isn't What It Used To Be
by Michael A. Gayed, CFASummary
- $USDJPY:$SPX ratio sinks to new lows, showing further de-correlation between the two assets.
- President Trump signing the Hong Kong bill in favor of protesters may be just what JPY bulls need.
- $USDJPY 1:2 risk-reward setup targets a new move to 105.
There's a tendency for the yen to strengthen because it's rated highly, but I don't think that accurately reflects Japan's economic performance. - Yoshihiko Noda
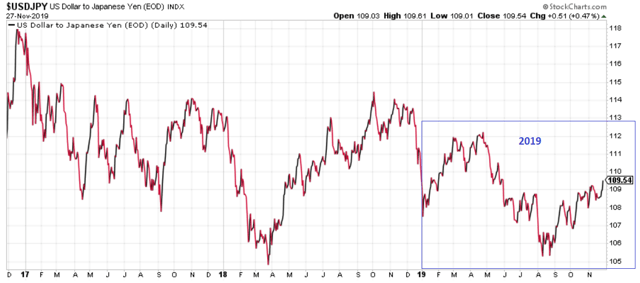
Despite the US stock market hitting all-time highs almost daily, the proverbial direct correlation with the USDJPY seems to have disappeared. A closer look at where the yen started 2019 reveals ranging conditions for one of the most popular currency pairs among investors.
The explanation for the correlation between the two markets comes from the low-interest rate level in Japan. Investors borrow in JPY and buy USD to pay for stocks in a risk-on environment. Hence, the stock market and the USDJPY rise and fall together.
Not anymore. Japan is not the country with the lowest interest rates anymore. Having lower rates became fashionable in the world of central banks lately.
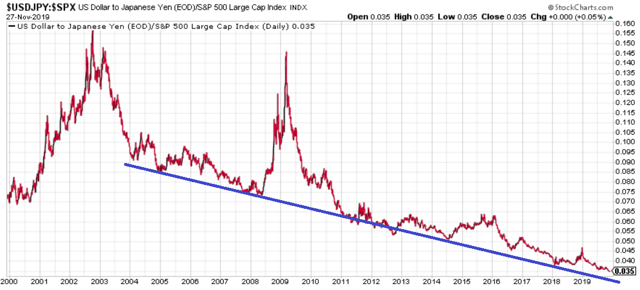
One of the most interesting charts of the last decade shows how the correlation mentioned above died of a slow death. The $USDJPY:$SPX ratio keeps sinking, currently at its lowest level in at least 17 years.

It reflects investors' drifting away for the old carry trade that ruled financial markets for a long time. And it requires new thinking when analyzing the $USDJPY.
The reason for the chart above is that by building a bullish case for the JPY - hence a bearish $USDJPY scenario - many would argue that it'll come only in the case of the stock market declining too. This could be the case, but my scenario here is short-term, and that would only bring a healthy correction to equities. Now that President Trump signed the Hong Kong bill backing protesters, the US-China trade deal is suddenly in danger of suffering some unexpected changes and/or delays.
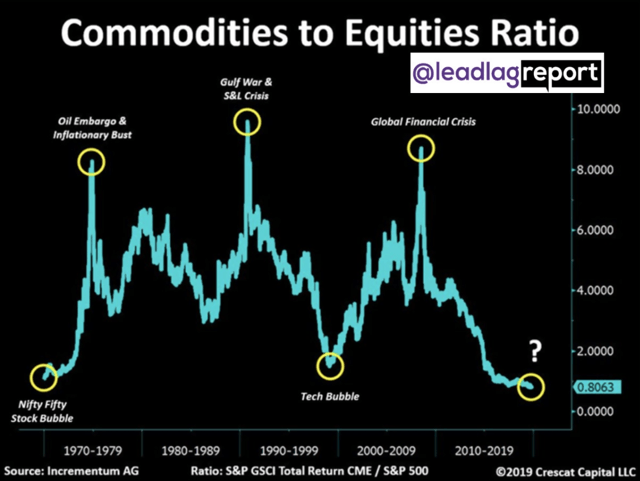
That would not be unusual. One of the last Lead-Lag Reports I wrote mentioned that a critical ratio of commodity prices relative to equity valuations recently reached a fresh 50-year low resembling two prior significant cyclical US stock market peaks in 1972 and 2000.

Coming back to the $USDJPY, it did nothing for the entire year. It dropped right when the trading year started, as US markets corrected sharply. While it rebounded, it didn't make up the lost ground - equities did, explaining the ratio showed earlier.

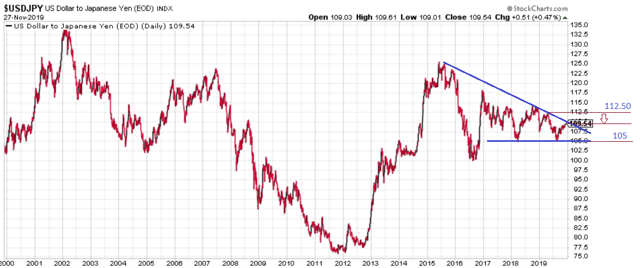
But if we consider more data, the inability to break the series of lower highs questions any bullish thesis. Therefore, if bears are still in control, should we treat the bounce from 104 to the current 109 level simply as a bounce? My take is yes.
The trade I'm looking at is nothing but an opportunity at the end of a contracting triangle. A technical setup, if you want, backed by the latest fundamentals - a short-term oriented trade.

The pair bounced every time it dipped below 104 - both in 2018 and 2019. The scenario here argues for a retest of that area, based on the rules of such a pattern - the last segment should pierce the trendline one more time if we are to see a bounce later.
Providing the pair doesn't move above 112.50 (invalidating the bearish scenario), the risk-reward ratio almost reaches 1:2, good enough for a trade into the Christmas holidays.
If history guides us, the sharpest moves in the $USDJPY pair are bearish. And they came accompanied by a stock market decline.
Could the Hong Kong bill be the catalyst?
Like this article? Don't forget to hit the follow button above?

--------------------------------------------------------------------------------------——How To Avoid the Most Common Trading Mistakes
Sometimes, you might not realize your biggest portfolio risks until it’s too late.
That’s why it’s important to pay attention to the right market data, analysis, and insights on a daily basis. Being a passive investor puts you at unnecessary risk. When you stay informed on key signals and indicators, you'll take control of your financial future.
My award-winning market research gives you everything you need to know each day, so you can be ready to act when it matters most.
Click here to gain access and try the Lead-Lag Report FREE for 14 days.
Disclosure: I/we have no positions in any stocks mentioned, and no plans to initiate any positions within the next 72 hours. I wrote this article myself, and it expresses my own opinions. I am not receiving compensation for it (other than from Seeking Alpha). I have no business relationship with any company whose stock is mentioned in this article.
Additional disclosure: This writing is for informational purposes only and Lead-Lag Publishing, LLC undertakes no obligation to update this article even if the opinions expressed change. It does not constitute an offer to sell, a solicitation to buy, or a recommendation regarding any securities transaction. It also does not offer to provide advisory or other services in any jurisdiction. The information contained in this writing should not be construed as financial or investment advice on any subject matter. Lead-Lag Publishing, LLC expressly disclaims all liability in respect to actions taken based on any or all of the information on this writing.