EUR/USD Technical Analysis: Euro visits six-week lows, trades back up near 1.1000 handle
by Flavio Tosti- EUR/USD low volatility extends into Friday as the market stays stuck near the 1.1000 handle.
- The key level to beat for bears is the 1.0996 support.
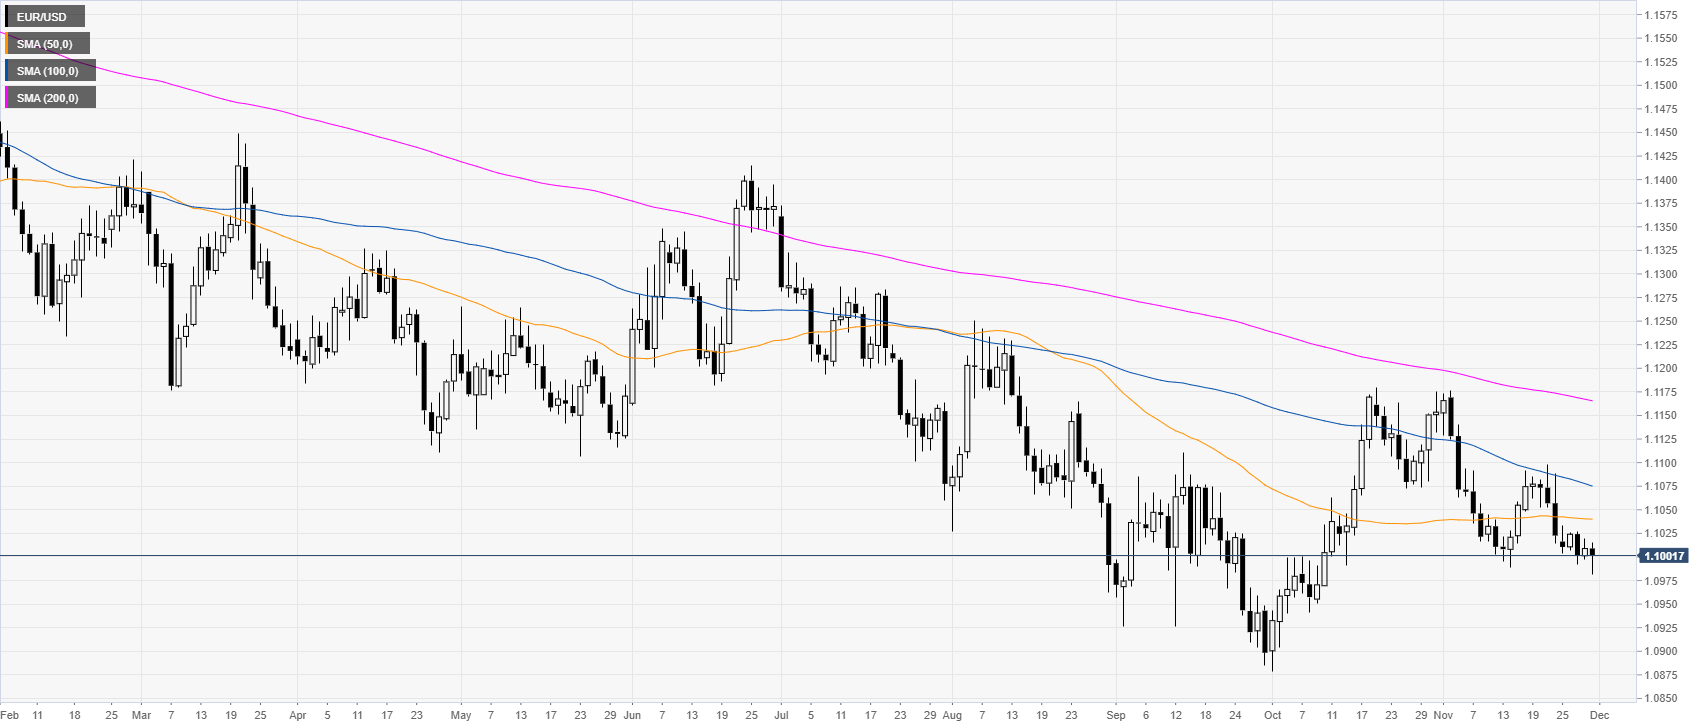
EUR/USD daily chart
The euro/dollar currency pair is trading in a downtrend below its main daily simple moving averages (DMAs) in the daily chart. This Friday, the price dropped to six-week lows, on an intraday basis.

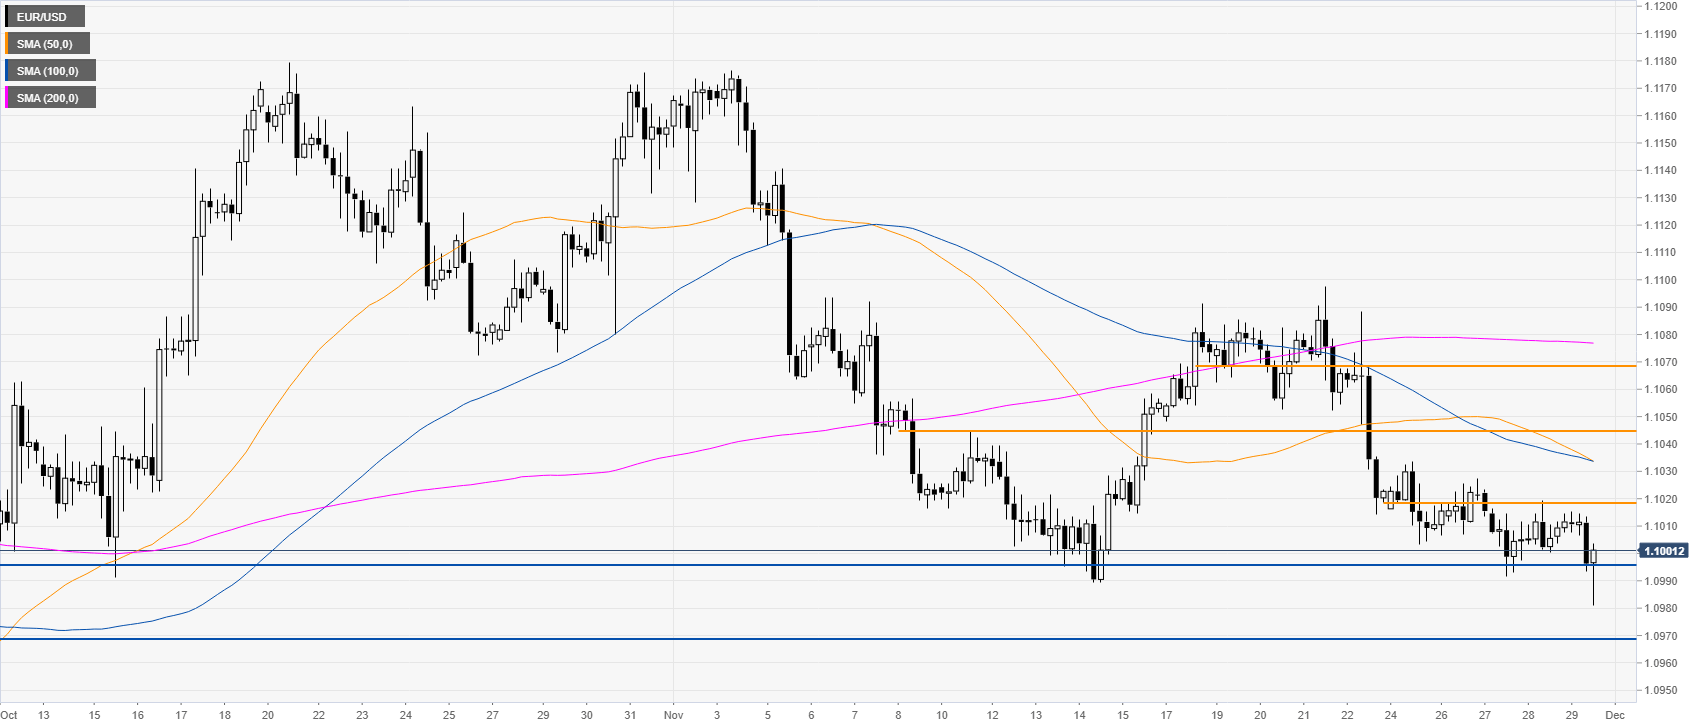
EUR/USD four-hour chart
EUR/USD is trading back near the 1.1000 handle as the market is reluctant to move down decisively. However, a daily close below the 1.0996 support level should open the doors to further losses towards the 1.0968 and 1.0916 levels, according to the Technical Confluences Indicator.

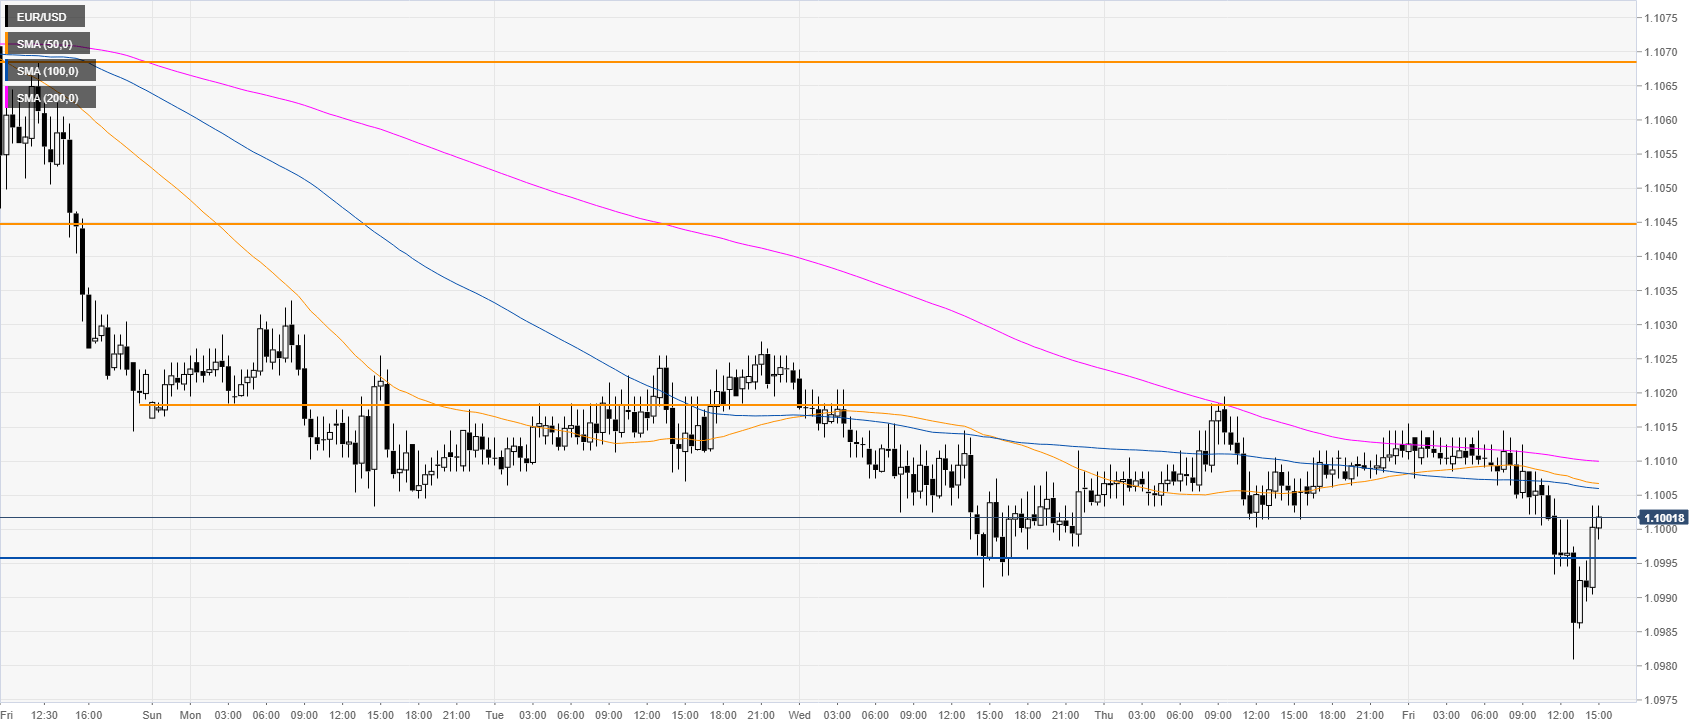
EUR/USD 30-minute chart
EUR/USD is trading below the main SMAs, suggesting a bearish bias in the near term. Resistance can be expected at the 1.1020 and 1.1048 levels. Further up lies the 1.1070 level.

Additional key levels
EUR/USD
| Overview | |
|---|---|
| Today last price | 1.1 |
| Today Daily Change | -0.0009 |
| Today Daily Change % | -0.08 |
| Today daily open | 1.1009 |
| Trends | |
|---|---|
| Daily SMA20 | 1.1049 |
| Daily SMA50 | 1.1041 |
| Daily SMA100 | 1.1078 |
| Daily SMA200 | 1.1167 |
| Levels | |
|---|---|
| Previous Daily High | 1.102 |
| Previous Daily Low | 1.0998 |
| Previous Weekly High | 1.1098 |
| Previous Weekly Low | 1.1014 |
| Previous Monthly High | 1.118 |
| Previous Monthly Low | 1.0879 |
| Daily Fibonacci 38.2% | 1.1011 |
| Daily Fibonacci 61.8% | 1.1006 |
| Daily Pivot Point S1 | 1.0998 |
| Daily Pivot Point S2 | 1.0987 |
| Daily Pivot Point S3 | 1.0976 |
| Daily Pivot Point R1 | 1.102 |
| Daily Pivot Point R2 | 1.1031 |
| Daily Pivot Point R3 | 1.1042 |